State of the Nations

David Bogle looks at trends for developing chemical engineers in Europe
CHEMICAL engineering skills are core to the success of the process industries which enable so many everyday products expected by consumers – such as transportation fuels, plastic goods, personal products, medicines, foodstuffs – to be manufactured. They also have a vital role at the heart of many of the world’s greatest challenges: developing a sustainable future and tackling the pandemic to name just two. Chemical engineers are employed by many industrial sectors as well as in regulatory authorities, arms of government, the charitable sector, and education. The salary premium for chemical engineers is high, demonstrating that they are held in high regard.
As the European Federation of Chemical Engineers (EFCE) Scientific Vice President I set out to explore whether the ecosystem for developing chemical engineers in Europe is optimal and consistent to ensure that demand is satisfied. The EFCE represents more than 100,000 chemical engineers in 30 European countries giving it a particular interest in the pipeline of chemical engineers across Europe.
Over the years, student recruitment has depended on economic cycles and the performance of the relevant industrial sectors. Currently, student recruitment is buoyant in many countries but age profiles within the academic community are quite diverse across Europe. By bringing together some statistics of age profiles and student to staff ratios I aimed to help national member societies in EFCE member countries and universities argue for more academic recruitment to maintain a strong discipline basis for chemical engineering in each country, if it is out of line with best practice. Consistent data is difficult to get. There is some information on Eurostat but the definitions and processes used were very out of line with how the chemical engineering community sees itself.
EFCE member societies were asked to give data on the following categories about teaching for chemical engineering degrees in universities in their country:
- Numbers of teaching staff (full time equivalent) in chemical engineering departments (or within broader schools) including academic staff, assistants, and teaching fellows (but not postgraduates and postdocs who teach).
- Average age of the chemical engineering teaching staff (as defined in the previous bullet point).
- Total number of students within chemical engineering departments in all years, ie Bachelor's, Master’s and PhD but not post experience short courses.
- The number of graduating chemical engineers with Bachelor's and Master’s degrees.
The way chemical engineering education is organised differs between countries. Chemical engineering can embrace chemical technology, process chemistry, process biotechnology and so on, but some do not include the same elements as others. The approach used here was to allow countries to define for themselves how they would draw the envelope around chemical engineering. Societies were asked to include those courses that graduate what they recognise broadly as chemical engineers and not those that include only a small element of chemical engineering.
Data was collected for 19 countries: Croatia, Czech Republic, Denmark, France, Germany, Greece, Italy, Lithuania, the Netherlands, Poland, Portugal, Romania, Slovakia, Slovenia, Spain, Sweden, Switzerland, United Kingdom and Ukraine. It was not possible to obtain figures for Bulgaria, Estonia, Finland, Hungary, Latvia, Russia, Serbia, Turkey, and Norway and only partial figures were available for Ireland and were not sufficient to be comparable.
Table 1 shows the data that were obtained. It is data mostly for 2018 with some more recent and the degree of accuracy is variable. However, I was looking for significant trends, so the data can be considered accurate as an engineering approximation to allow drawing some conclusions.

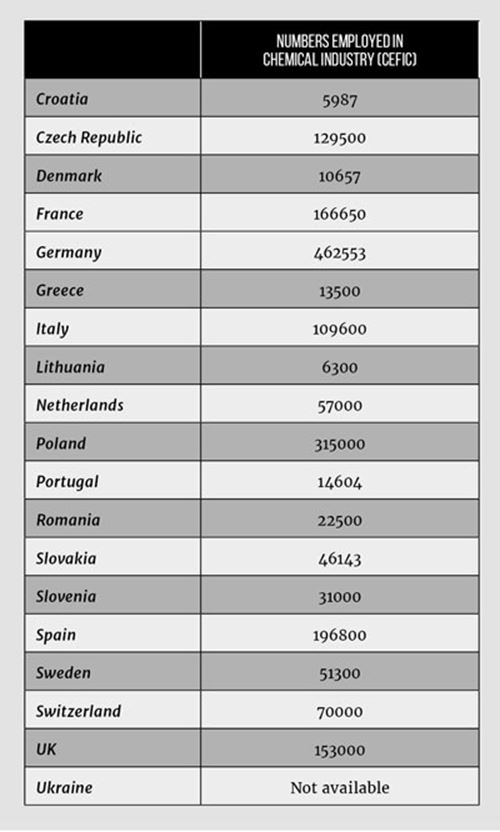
From the raw data I calculated the student/staff ratio, the number of chemical engineering graduates per 100,000 population and the number of graduates per 1,000 in the national chemical industry workforce as reported to CEFIC. These are shown in the subsequent tables (Tables 2–5) presented in rank order for each particular indicator. Table 6 gives the number of people employed in the chemical industry as reported to CEFIC for 2018.
It is possible to make some comparisons on the basis of these indicators although comparisons between countries need to be made with care. The total numbers of staff and students for each country needs to be considered with respect to the breadth of courses considered, the industrial base of the country, the duration of the courses and the extent of recruitment of chemical engineers to employment beyond the traditional industries of chemicals, pharmaceuticals, oil and gas. While bearing these issues in mind and recognising that there is no ideal profile, we can look at some overall trends.
Tables 2 (age) and 3 (student/staff ratio) give an indication of the investment in chemical engineering education by the countries over recent decades. Lead times for seeing the effects of new staff investment are long since academics with substantive responsibility are often appointed in their early 30s. For those countries where the average age is high it means that over the last 20 years or so there has been less investment in young staff leading to an ageing staff profile. Of course averages can hide unusual age distributions but mostly staff are appointed rarely and in a steady fashion except where a new institution or department is started.
Denmark, Slovenia, Sweden, UK and Lithuania are at the lower end. The case of the UK is interesting since there is now no retirement age so staff can continue in post for much longer so we could expect a higher average. It indicates that there has been a continual renewal leading to a low average. UK Universities have complete freedom in recruitment. This is not the case in some other countries where national competitions are organised, staff are appointed as public servants employed by the state, and ministries can control the number of posts that are opened.
The student/staff ratio varies very considerably from around 17:1 to 6:1 (the figure for Ukraine is a clear outlier based on a rather different organisation of the studies. Of course these findings for Ukraine are upended by the invasion of Russia and the desperate situation the country now faces). Some of this may reflect how teaching staff are defined but the range is striking. This is affected by the stage in the curriculum at which chemical engineering academics included here begin to teach. In some cases they teach little in the early years of the study programme. It seems that across Europe there are broadly two traditions: one with a ratio of around 16 and the other around 8. It is likely this reflects a different organisation of studies and of the staff that teach them. The UK is at the higher end reflecting significant increase in numbers without sufficient staff recruitment although to some extent this has begun to be addressed.
It is interesting to see how the numbers compare with the size of the population as shown in Table 3 (graduates per 100,000). Comparisons must be tempered with the knowledge that the size of the industrial base varies significantly. However the formation of chemical engineers prepares graduates for a wide range of careers such as environmental management, energy regulation, water treatment, medical applications and many others where there is chemical and physical transformation of materials.

Traditional career routes are in the chemical and energy sectors. CEFIC provides figures for employment on the chemical industry, and Table 4 gives the number of graduates per 1,000 employed and Table 5 the CEFIC figures from which Table 4 was derived. The CEFIC figures include the chemical and petrochemical industry but not the pharmaceutical industry or oil refining, both of which are strong in the UK.

Countries are producing very different numbers per head of population and per 1,000 in the chemical industry workforce. Portugal’s industry is relatively small but is producing graduates going into a wide range of industries and careers with a significant proportion being recruited as consulting engineers. Romania has a long tradition of producing chemical engineers because of the long-standing size of the oil and gas sector. The UK figure is also high possibly because academic programmes and the research base have promoted the value of chemical engineering skills well beyond the traditional employment sectors.
The results show a significant variation in the various indicators across European nations. The average age of staff is not so wide but it does reflect the lack of investment in new academic staff that has been reported by colleagues in Ukraine, Italy and Greece. Student-to-staff ratios show a very wide range. The comparisons against the chemical industry employment numbers need interpreting carefully but again if the number is low and there are reports of shortages by the main employers the figures would provide support for the need for more graduates. The numbers are worth considering by the main process industry employer organisations since their interest is in productivity which can be hampered by lack of skilled engineers. For example there are frequent reports of engineering skills shortages in the UK. The results indicate that the UK has a strong pipeline, a staff complement that is being refreshed, and is producing graduates commensurate with size of the industrial base and population. However we know that chemical engineering graduates are in demand in a wide range of roles so there is scope for further increase.
An extended article describing this work can be found on the EFCE website.
Recent Editions
Catch up on the latest news, views and jobs from The Chemical Engineer. Below are the four latest issues. View a wider selection of the archive from within the Magazine section of this site.