Interactive Graph Resource for Chemical Engineering Design
Interactive graphs have the potential to provide students with a more dynamic and engaging learning experience. With that in mind, The University of Manchester’s Department of Chemical Engineering has produced an interactive set of graphs that can be easily embedded into any virtual learning environment
Traditionally, when teaching chemical engineering topics, instructors tend to use graphical methods such as McCabe-Thiele and Ponchon-Savarit plots to help explain fundamental concepts and design approximate unit operations. As some teaching activities move online it is useful to move these graphic methods there, too. However, static images don’t have the educational impact of something that can be used interactively by students.
Attempts at building a resource of interactive graphs have tended to be based on standalone systems. Two examples are Wolfram’s Mathematica which has been employed at the University of Colorado Boulder, US across a range of chemical engineering topics; and a custom separate system, LABVIRTUAL, created by the Portuguese universities of Coimbra and Porto containing figures and animations.1,2 Although these have been shown to be useful to students, they require either downloading code or plugins for standalone plots and thus don’t have seamless integration into material for student learning on most systems.
Development
We have therefore created a collection of slim single-page applications (SPA) written in HyperText Markup Language 5 (HTML5) and Cascading Style Sheets 3 (CSS3) with the numerical calculations undertaken in JavaScript. The numerical calculations are then sent to the Plotly graphical plugin for display on the web page. The two key benefits of this implementation are, firstly, that SPAs work well on low-powered devices such as smartphones and tablet computers. Secondly, with relevant CSS3 flags, the content provided when called from an external site can be controlled via the base webpage. This means there can be seamless integration in a virtual learning environment (VLE), such as Blackboard or Canvas.
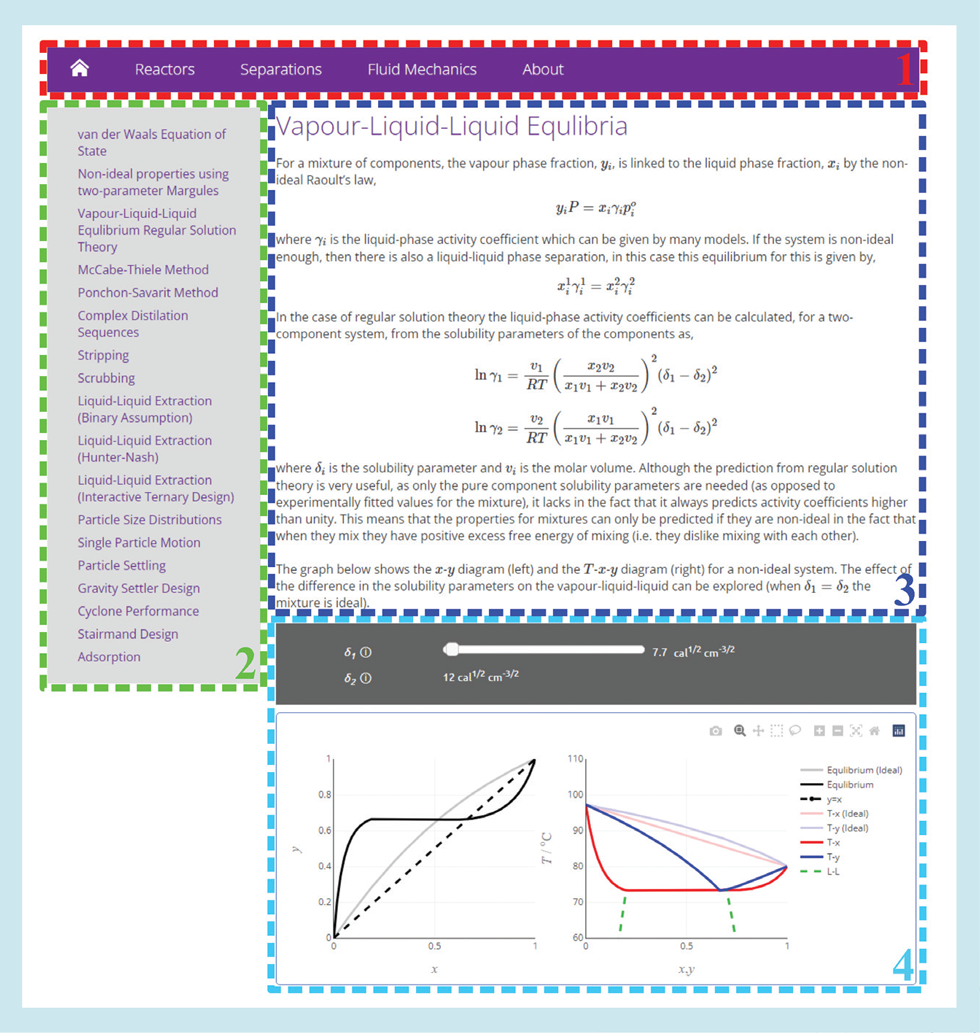
The general webpage for each topic is divided into four main panels as illustrated in Figure 1. Panel 1 is the navigational header bar to move the user between subject areas of the site (Reactors, Separations, Fluid Mechanics, About). Panel 2 is the content panel to move the user between the different topics within a specific subject area. Panel 3 is an introductory and/or theoretical information section about the topic (the content in this area changes depending on the topic and can be text, equation, or video recordings), and Panel 4 presents the main interactive graph with control sliders. When a page is called from an external application, for example a VLE, only Panel 4 is displayed.
When using graphs, students must identify important features (such as the shape of the lines), then identify the quantitative facts or relations (such as the relationship that line represents between the x and y axis), and then relate those quantitative relations to the plotted variables (such as what the x and y axis are representing). In order to make the graphics as clear as possible, we have used legends on most graphs, as these are typically used in science communication and students need to be familiar with these.
We have created a collection of slim single-page applications (SPA) written in HyperText Markup Language 5 (HTML5) and Cascading Style Sheets 3 (CSS3) with the numerical calculations undertaken in JavaScript
Implementation
The method to call the graph from an external application is to use a standard html iframe (where the width and height can be set to the relevant size required for each graph). Copy the example iframe below into your VLE system or webpage to try out embedding the interactive graphs for free:
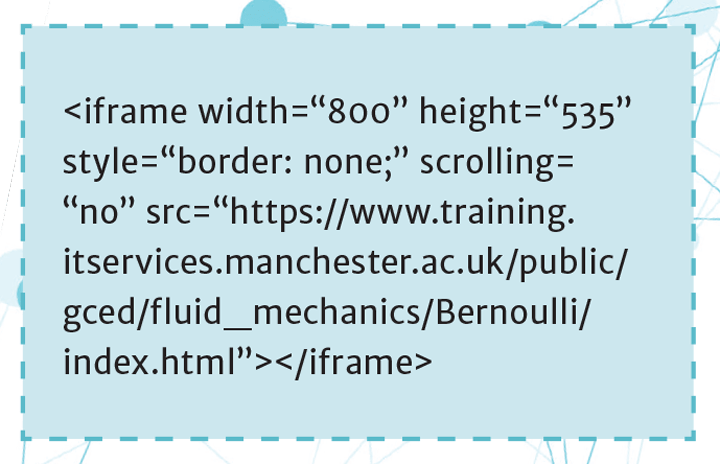
Figure 2 is an example implementation into Blackboard, the VLE system used at The University of Manchester. The main interactive graph with control sliders, Panel 4, is viewable seamlessly with the weekly learning content, for example a mixture of short videos, self-test quizzes, and key information, as in Panel 5. We also tend to use a hard link, Panel 7, if students need to open the graph in a separate window, either for a larger version, or if there are any issues with their Blackboard version.
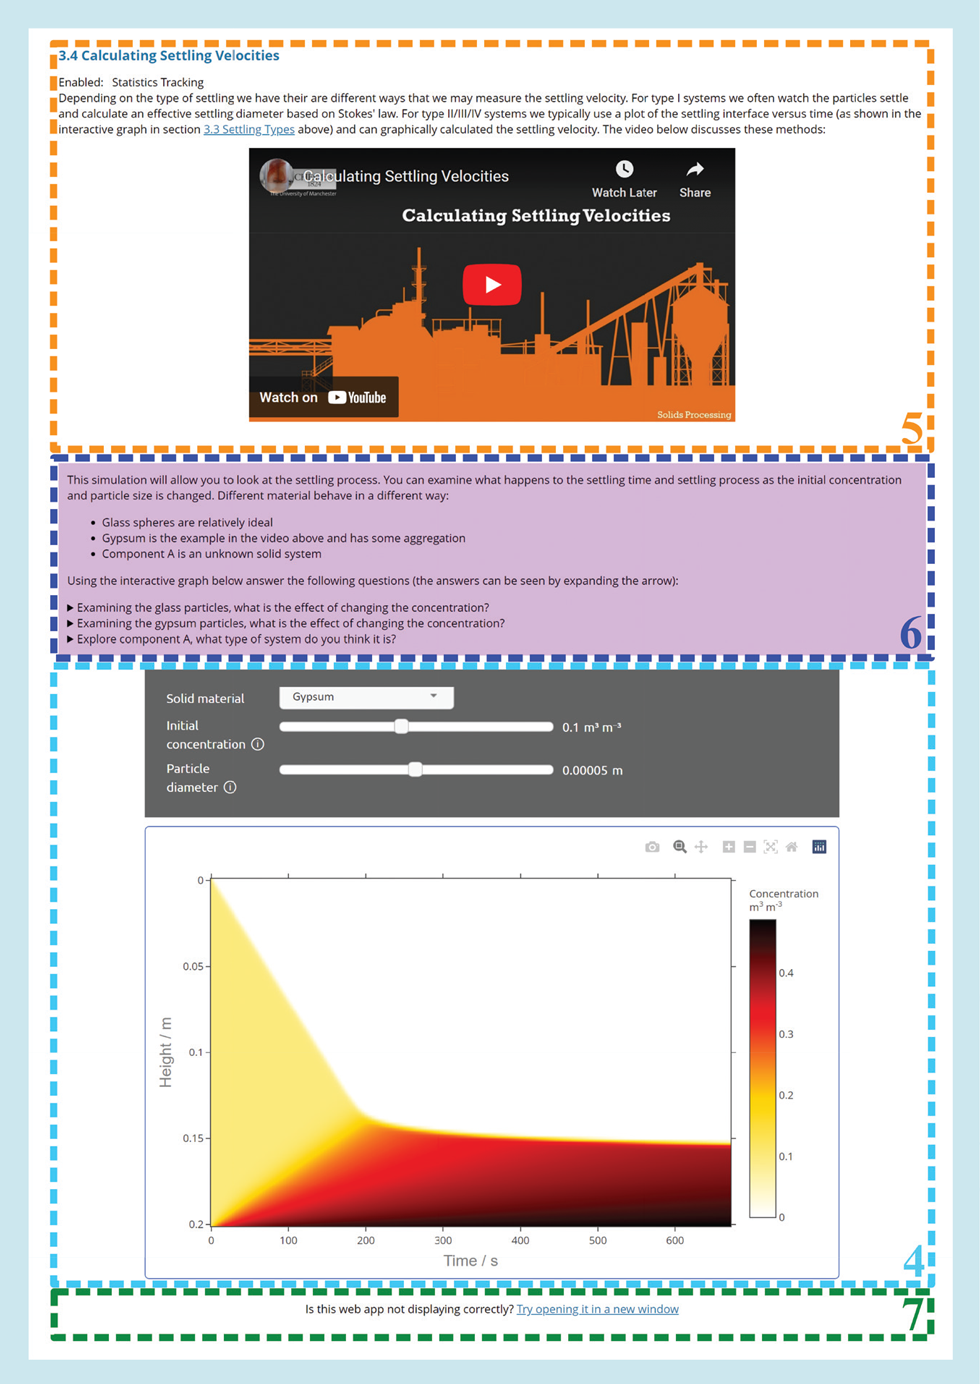
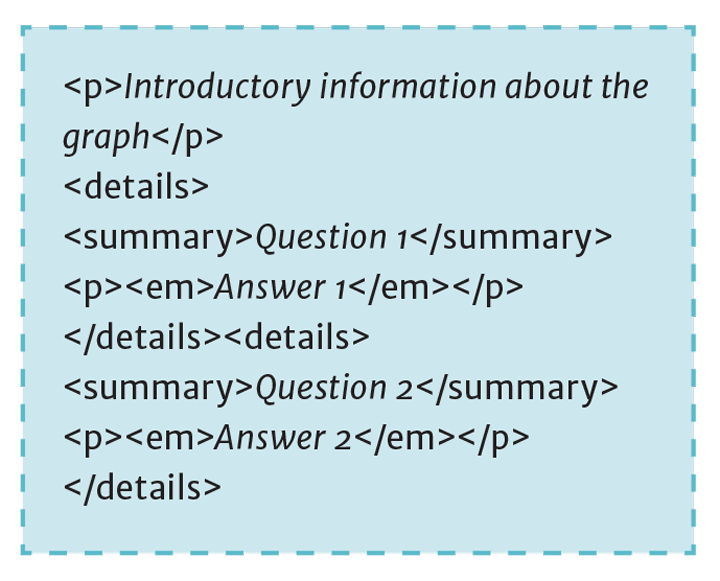
One key addition to the interactive graphs when embedded into the VLE is questions (Panel 6 in Figure 2) to get students to explore the graphs and to gain learning from them rather than just to move the sliders around with no purpose. To allow students to undertake their learning, the small arrow bullets allow students to expand answers by clicking on them, using the details/summary html elements:
It is important that these questions guide student learning and point out key information that students should be taking from the graphs. Students can also be asked about the viability of answers, and the accuracy that they think is suitable, eg the number of significant figures that they should think about. Alternatively, a short quiz element can be used to support the graph which will record a formative mark for students. The questions also need to be well linked to the learning outcomes as this will ensure students are focused on the key learning level.
Student feedback
To trial the interactive graphs, we implemented them on two modules, a first-year module with 161 students and a second-year module with 111 students. Not only did we want the interactive graphs to improve student learning, but we wanted to understand what drives students to use such resources. A resource can be amazing at helping students learn a concept, but if they don’t use it then it will have no effect on their learning.
From our study we found that the main drivers for students’ intention to use the interactive graphs are the outcomes that they expect to gain and how enjoyable they find using them. If students feel they are getting more benefit from using the graphs and they like using them, then their intention to use is higher. A higher intention to use the graphs then translates to more students making them part of their weekly work.
Additionally, we asked students how much they agreed or disagreed with the statement: “The questions prompted me to explore the interactive graphs”. Close to 80% of the responses were in positive agreement with this statement. Over 85% of the students responded with positive agreement to “The quality of the interactive graphs was appropriate for use”, with over 80% in positive agreement to both “Interactive graphs with questions allowed me to understand the subject better” and “The interactive graphs improved the quality of teaching on the course”. These can be thought of as the main purpose of the interactive graphs, so from a student perspective, they appear to have been successful.
Around 75% of the students reported that they used the interactive graphs regularly (at least every other week) with 73% of the students using each interactive graph more than once during their learning activities. Less than 5% of students reported not really engaging with them at all.

Recommendations
When using the interactive graphs, it is important to consider the following recommendations:
- Ensure that the graphs are aligned with the weekly learning objectives and part of the typical learning material: Students are more likely to want to use a resource if they think that it is relevant and will benefit their learning. Being part of thetypical material (and not a one-off) means using them is more likely to become a habit for students
- Ensure that the interactive graphs are embedded within the virtual learning environment: If students must link to an external resource, this additional effort can negatively affect their intent to use the graphs
- Make sure the graphs are simple to use and consolidate the key topics: Students are more likely to want to use the graphs if they are easy to use and provide a summary for them (and also, if they are fun)
- Provide some scaffold questions to help the students get the most out of the interactive graphs: Questions help the students to explore the interactive graphs. These questions guide their learning and can be used to point out key information that students should be taking from the graphs
- Ensure that the scaffold questions are constructively aligned to the learning outcomes of the course: This will make sure that students are focused on the correct learning level. For example, if the intended learning outcome (ILO) is “describe” then the questions should focus on getting students to look at the shape of the graph, while if the ILO is “design” then questions should focus on the understanding of how the size or shape of the equipment is affected
- Provide scaffold questions to make students focus on general chemical engineering skills: Questions can help students take away more general skills. For example, it is important that students learn what values are significant. Students should be prompted to examine the accuracy of the solutions when thinking about the effect of the variables. This will help them later when they produce their own simulations to know what sensible values are
- Ensure students have immediate and easy access to the answers to the scaffold questions: Immediate and easy access to guided questions helps students check their thoughts and move on, rather than getting stuck. This provides a self-check on their knowledge
- Incorporate the interactive graphs within live teaching sessions: Bringing the graphs into live workshop sessions increases students’ use of the graphs and helps explain key topics. This also allows greater tie-ins to other activities and problem solving
Putting into practice
The full collection of interactive graphs can be accessed at the Graphical Chemical Engineering Design website.3 If you’re a student, you can access these directly to supplement your learning. If you’re a lecturer, you can check out the graphs and embed them into your teaching, thinking about the recommendations outlined on this page. The resource is constantly being updated and added to, so there will be more topics covered in the future.
This is the fourth in a series of articles in which colleagues will explore various aspects of digitalisation of engineering education in more detail.
References
1. JL Falconer, and G Nicodemus, Interactive Mathematica Simulations in Chemical Engineering Courses, Chemical Engineering Education 48(3), pp165–174, 2014
2. JF Granjo, MG Rasteiro, LM Gando-Ferreira, FP Bernardo, MG Carvalho, and AG Ferreira, A Virtual Platform to Teach Separation Processes, Computer Applications in Engineering Education, 20, pp175–86, 2012
Recent Editions
Catch up on the latest news, views and jobs from The Chemical Engineer. Below are the four latest issues. View a wider selection of the archive from within the Magazine section of this site.