Modelling with Excel Part 9: Digitising a Chart
Stephen Hall continues his series on how to use Excel for project engineering. Download the interactive workbook to experiment with as the series develops
In my work, I frequently extract data from journal articles to utilise in my models. These articles not only provide information on data acquisition but also present limitations and assumptions that bolster my confidence in their use. However, a common issue arises when the data is presented in chart form rather than as tabulated values. This poses a considerable challenge as I find myself struggling to read accurate values from these charts.
To address this problem, I created this month’s project – I call it “MouseClick” – with the specific goal of enhancing the precision and efficiency of reading data values from printed charts.
My approach utilises Excel’s ability to record the X-Y coordinates of the mouse pointer whenever the mouse button is clicked. Working with a scan or screenshot of the chart, the user clicks along the chart’s X- and Y-axes to calibrate the coordinates. They then click along the data lines on the chart to capture the corresponding values.
The procedure has two parts. The first part uses an Excel UserForm and its code sheet to collect screen coordinates for the axes and data points. The second part is implemented on a worksheet where the data coordinates are transformed into their values and, if applicable, they are correlated to an equation. A working implementation is included in the companion spreadsheet at www.pipesizingsoftware.com/excel
Userforms
Visual Basic for Applications (VBA) has a module for creating screen forms (“UserForms”). Forms can enhance the functionality and user experience of Excel-based applications. They can be tedious to create, however, so I use them only when the benefits justify the effort to create and test them.
If you are new to UserForms, please refer to one of the many online tutorials1 that give detailed instructions for creating them. A finished form is called by your Excel model either automatically when a certain condition is met or manually by executing a subroutine in a standard VBA module. For example, you can draw a rounded rectangle on your worksheet and link it to the subroutine; click the rectangle and the subroutine will execute. The subroutine displays the form as a new window and then transfers focus to the form. The subroutine resumes when you exit the form, either by clicking the window’s “x” or through the action that is programmed by one of the form’s command buttons.
UserForms contain controls such as command buttons, checkboxes, text boxes, and scroll bars. They can include labels and images that furnish information to the user but perform no actions. When a user interacts with a control, by clicking on a button for example, an underlying VBA procedure executes. Excel needs to know the exact position of the pointer when a user clicks the mouse to determine whether to execute a control. My procedure harnesses that knowledge to obtain the screen coordinates.
What it does
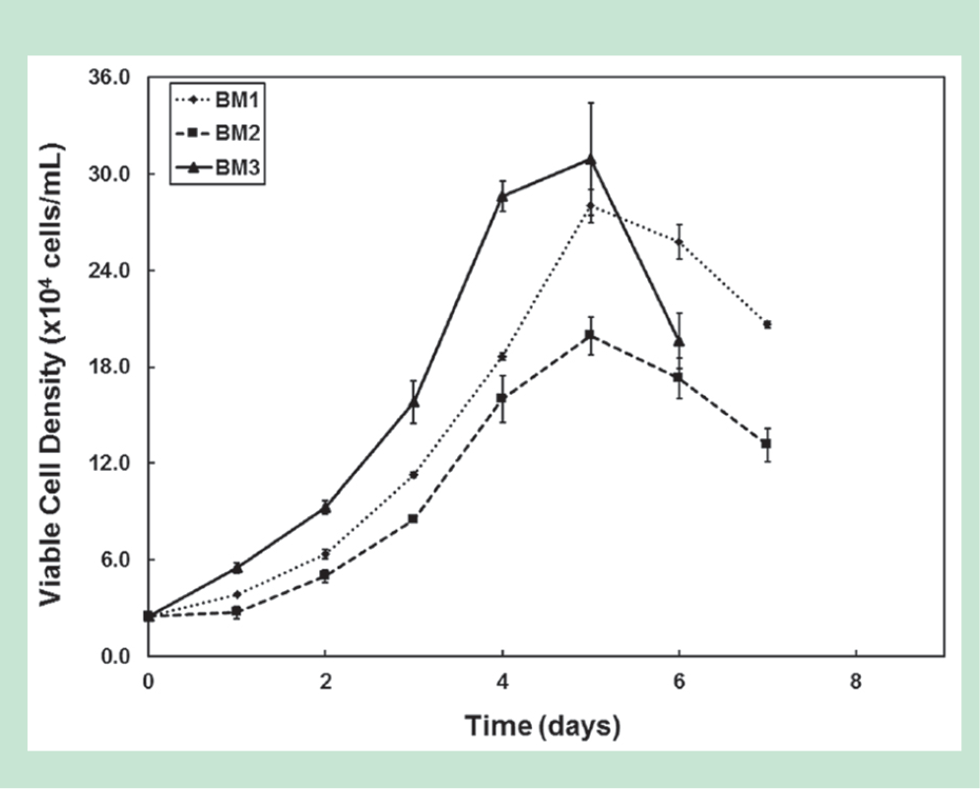
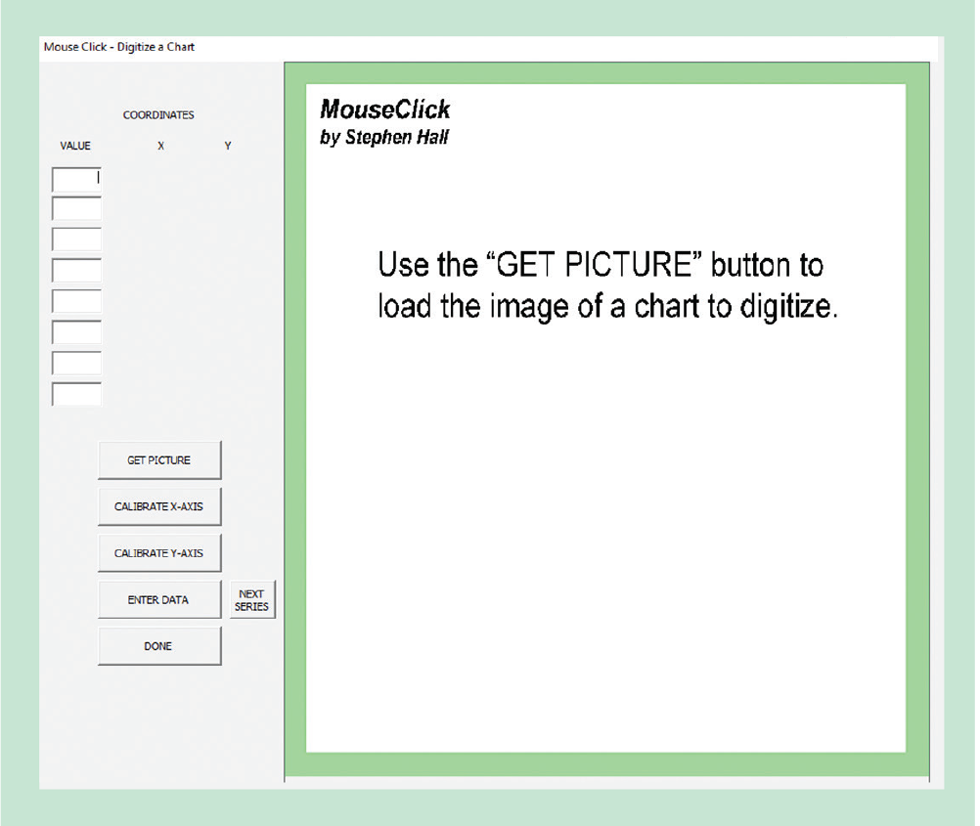
Figure 1 gives a typical chart from the literature. The axes have tick marks but there is no grid, making it difficult to read the values. Figure 2 is the UserForm that is displayed when a “RUN” button (linked to a macro) is clicked on the worksheet. The workflow is given by the column of five command buttons.
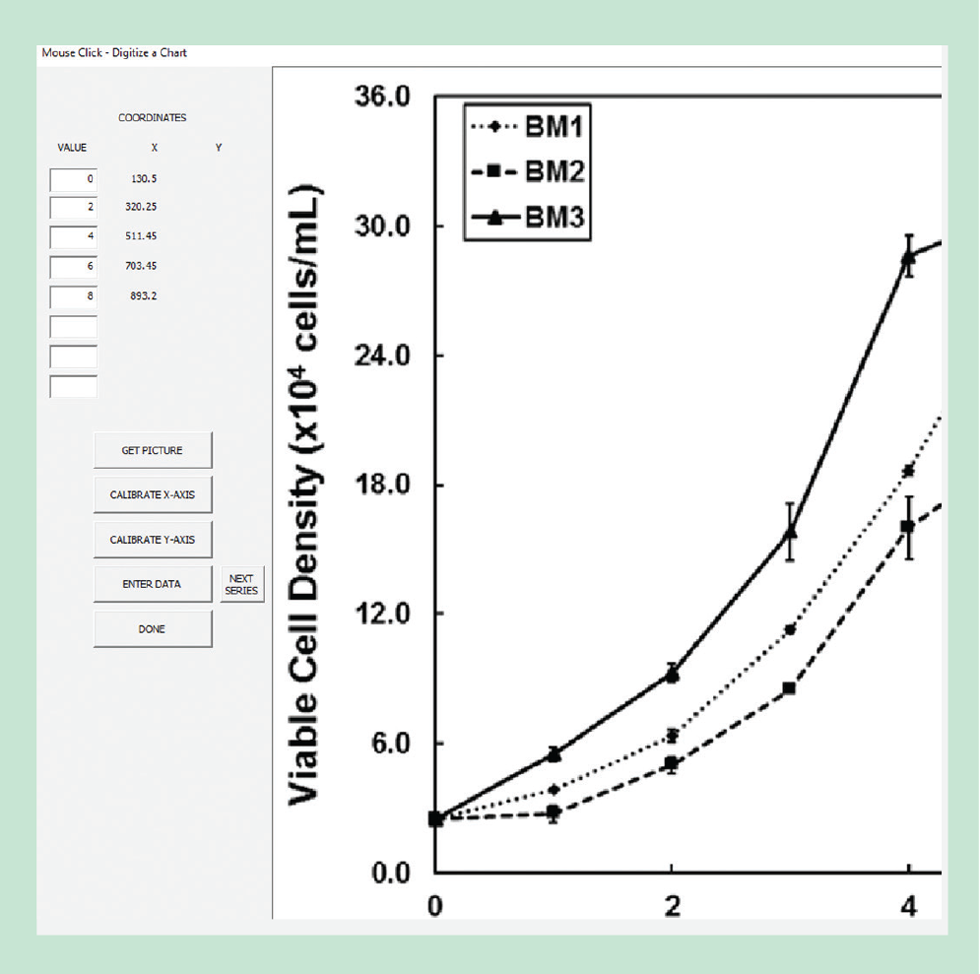
First, “Get Picture” to load a .jpg image to the form. This displays your image and resizes it to fill the window (see Figure 3). Each element on the UserForm has underlying code that resides on the VBA sheet (not a standard module). When a user performs one of a set of possible actions, the corresponding code executes. Each of the form elements and actions are named. Thus, when “Get Picture” is clicked, the procedure called “Sub CommandButton1_Click” is executed. The only thing that routine does is call the “Import Image” subroutine that is saved in the MouseClick module.
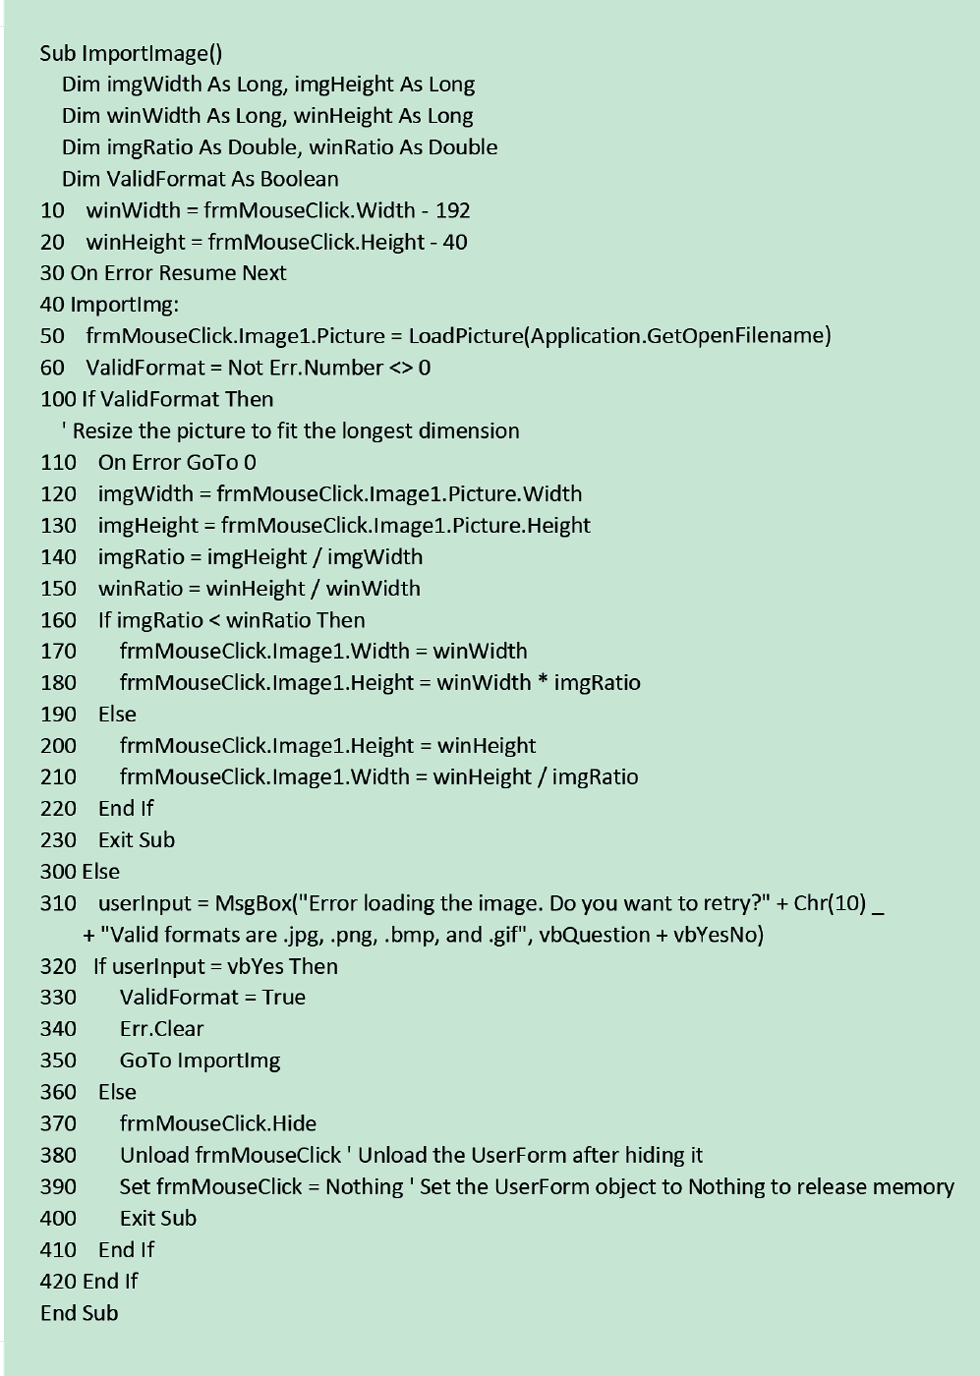
In Listing 1, Line 50 calls an intrinsic function in Excel that presents a dialog box for navigating your drives and selecting a file to load. Line 60 throws an error if the selected file has an illegal format. Lines 120–220 resize the image to the window; notice that the aspect ratio is not preserved. Lines 310–340 recover from the illegal format error.
The next three buttons move the focus to the X-axis, Y-axis, and image coordinates respectively. When you click these buttons the public variable “DataInput” is updated to the values 1, 2, or 3, which correspond to the buttons. They also perform some housekeeping on the worksheet by erasing old values and updating range names.
At any time, you can click directly on the image. This executes the code that is called “Image1_MouseDown”. It places the X- and Y- coordinates of the pointer when you click, relative to the upper-left corner of the image and saves them to the section of the worksheet that “DataInput” references.
Clicking the “Done” button closes the UserForm and exits back to the worksheet where you can make further manipulations. But before exiting, another subroutine is run (“AddNewChartSeries”) that configures the chart on the worksheet to display only those data series that you just captured on the UserForm.
Clean up the data on the worksheet
The UserForm interactions save X- and Y- values that correspond to screen coordinates, and they save the coordinates for the data series. Further calculations on the worksheet convert the data series coordinates to values.
First, a linear regression calibrates the two axes to the screen coordinates. Then a formula uses the regression coefficients to calculate values from screen coordinates for the data. There are checkboxes on the worksheet that specify linear or logarithmic X- and Y-axes. The formulae used for regression and value calculations differ depending on the logarithmic selection.
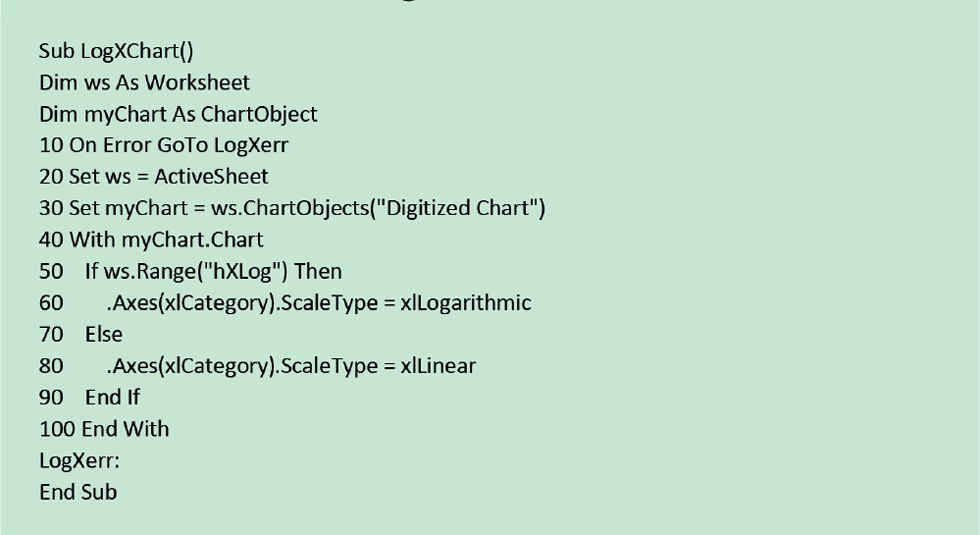
To keep the chart current with the logarithmic selection, the two checkboxes are linked to VBA subroutines. Listing 2 is the one for the X-axis. The checkboxes are also linked to a cell that are named “hXLog” and “hYLog”, respectively. The subroutine reads the value (TRUE or FALSE) of the cell and sets the format of the axis to match. Line 10 in the subroutine is important; it exits the routine if an error is encountered, such as a missing chart.
The macro names the worksheet ranges where the axis values and screen coordinates are written. In Figure 4, these are in the “Inputs” section. The X-axis names are “lX_Axis” and “lX_Coordinate”. The formulae for the slope and intercept are:
=IF(hXLog,SLOPE(LOG(lX_Axis),(lX_Coordinate)),SLOPE(lX_Axis,lX_Coordinate)), and
=IF(hXLog,INTERCEPT(LOG(lX_Axis),(lX_Coordinate)),INTERCEPT(lX_Axis,lX_Coordinate))
Slope is named “Xm” and intercept is named “Xb”. The subroutine writes the screen coordinates for the chart’s data points on the worksheet in the section called “Calculate Values from Coordinates”. The formulae in the X and Y columns are:
=IF(C59>0,IF(hXLog,10^(Xm*C59+Xb),Xm*C59+Xb),””), and
=IF(D59>0,IF(hYLog,10^(Ym*D59+Yb),Ym*D59+Yb),””)
Recent Editions
Catch up on the latest news, views and jobs from The Chemical Engineer. Below are the four latest issues. View a wider selection of the archive from within the Magazine section of this site.