Useful Data Needs More Diagrams Not More Data
Grant Wellwood explains how consultants with process empathy hold the key to unlocking value from data and how a simple graphic device can enable you to participate in the growing data economy
DATA are dumb. Therefore, collecting all you can in the hope of getting enough to reveal hidden secrets about your process is even dumber. Yet, based on first-hand experience, many organisations have adopted this ineffective data strategy, creating cost rather than profit centres.
Consider a package plant designed to neutralise acidified waste with lime (see Figure 1).
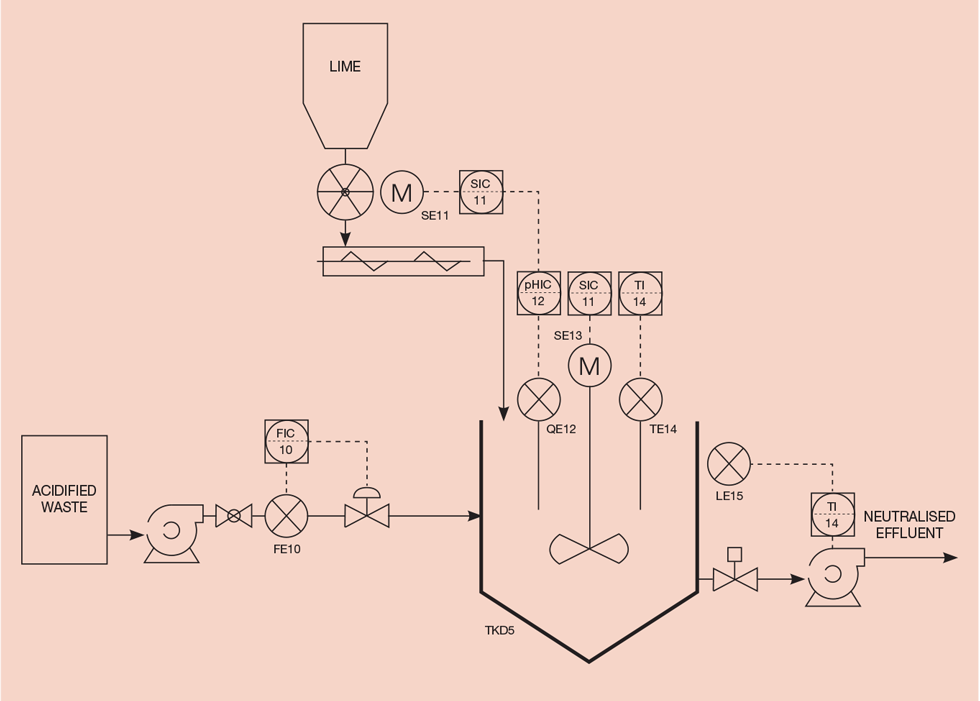
The plant is well-instrumented, and in accordance with your organisation’s data posture the outputs from all six sensors are written to short-term memory every three seconds and after seven days aggregated into hourly averages for archive.
Peripheral to production, the neutraliser does not get the attention of the production-focused operation’s team, despite some inherent process control challenges. The workaround is to simply overdose with lime and take the hits. As long as the effluent pH stays above the regulatory limit so its daily report light stays green, the plant’s sub-optimal performance can be normalised.
However, with increasing focus on cost and environmental impact, the wider organisation has turned to their data investment to find material improvements. As the operations team has failed to extract any actionable insights, management engage an external data science consultancy to get the job done.
“Collect it all” data strategies are often based on the premise that normal variations within a complex system constitute a natural experiment, where all possible variable permutations are being continually tested. Capturing the spectrum of outcomes together with their context therefore provides the foundation for an offline forensic examination to reveal the hidden improvement insights within. While all this is correct there is one problem, raw data are dumb. The most sophisticated machine learning algorithms cannot compensate for absence of basic process insight and as we shall see, data without process understanding simply creates an interpretation burden, not insight.
After a couple of weeks, the consultants excitedly herald the “discovery” of an insight that will materially improve neutraliser performance. The recommendation is to modify (insulate and trace heat) the tank [TK05] to increase its temperature, which was found to be strongly correlated with pH.
Seen through the eyes of someone who understands the process, this recommendation is a nonsense. Correlation does not equal causation. However, if you know nothing about the generating process, and all you have are tags and numbers, it’s impossible to tell. Raw data convey nothing about cause and effect, which is what we really need to know to identify the actionable insights. In this instance, temperature has been assumed to be the cause, which is not unreasonable. After all, temperature is the cause of so many everyday effects (cooking, burns, ignition, comfort, drying, melting etc). However, in this instance it’s an effect resulting from a chemical reaction.
The key to unlocking value from the data is domain knowledge, so let’s continue with the story and see how it plays out.
After the bemusement of such a daft recommendation wears off, the realisation that neutraliser performance is now on the management radar sets in. Maintaining production targets is demanding so you engage a process consultant to take care of the matter on your behalf.
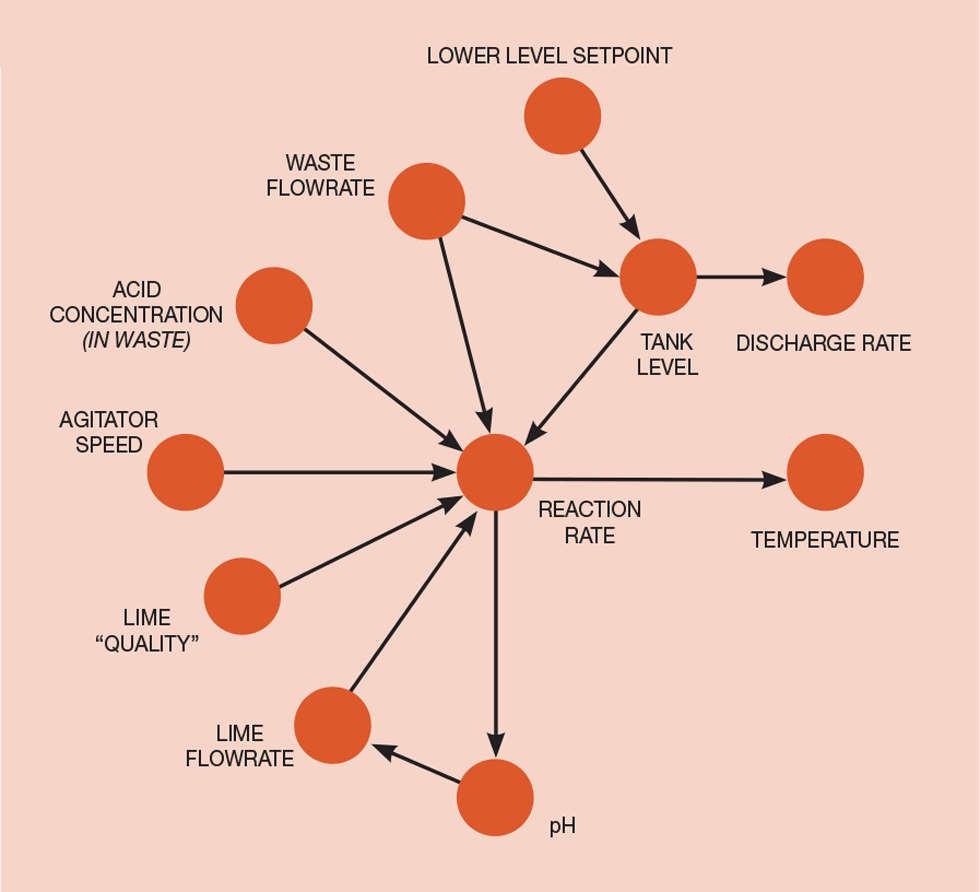
Rather than start with the data and blindly mining for insight, she starts with the generating process and creates what she calls a causal diagram. This simple dot and arrow construct shows all the parameters of interest (variables) as dots, with arrows to the variables they influence. She explains that links are hypothetical experiments and that each arrow is a statement about the expected impact of a change in the parent variable. Conversely, the absence of a link constitutes an assumption (no causal relationship) and the culmination is the power to predict the effect of an intervention without enacting it.
The draft causal diagram was then shared with front-line operators to capture plant-specific nuances and to get their buy-in (a nice touch!). Interestingly, the diagram also featured “reaction rate” which is classified as a lurking variable (an influential variable that can’t be easily measured). She explains that efforts invested into constructing an accurate causal diagram pay off in terms of the fact you can’t answer a question you can’t ask, and you can’t ask a question you can’t frame.
With the agreed causal diagram (see Figure 2) in hand it was easy to realign the expectations of our management (lapsed technical colleagues) as there is no causal link (arrows) between temperature and lime consumption. The correlation between temperature and pH is a spurious one confounded by reaction rate.
Recent Editions
Catch up on the latest news, views and jobs from The Chemical Engineer. Below are the four latest issues. View a wider selection of the archive from within the Magazine section of this site.


