Rules of Thumb: Vapour Pressure and Viscosity Equations
Stephen Hall discusses the golden rules for design
VAPOUR pressure and viscosity, temperature-dependent physical properties, play central roles in many calculations. This article explains how to regress the property data to determine coefficients for popular equations that predict the vapour pressure of viscosity at any temperature, provides Visual Basic for Applications (VBA) function subroutine to perform the calculations, and explores the goodness-of-fit for three viscosity equations.
Vapour pressure
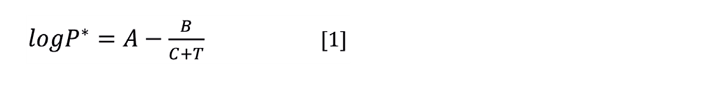
Vapour pressure is usually described with the Antoine equation (Equation 1). With two or more data points you can find the Antoine coefficients that give the best fit to your data. The customary units for pressure and temperature are mmHg and °C although any units may be used. Similarly, the equation is written for log (base 10), but it’s equally valid to determine the coefficients using the natural logarithm.
How can you find three coefficients (A, B, and C) with just two data points? Set C = 230 and then find A and B by solving two equations for two unknowns. This will force the curve through your two points (usually at the boiling point and at 20°C or 25°C) and give a fair representation in the temperature range between your two points.
With three points you can solve three equations for three unknowns and force the curve through all three points. With three or more data points, use multivariate linear regression to find the best fit. This requires that the equation be rearranged into a linear form. Regressing three data points gives the exact same coefficients as solving three equations simultaneously.
This is the procedure for regressing the data in Excel. Data manipulations are required before and after using the regression tool in Excel (LINEST). Once you have set this up in a spreadsheet, you only need to plug in a new set of vapour pressure data to immediately calculate the Antoine coefficients for the new data.
1. Rearrange Equation 1 to give it a linear form.
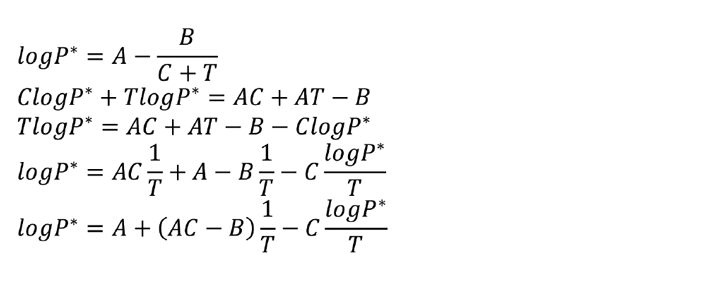
2. The equation now fits the structure needed to perform a multivariate linear regression.
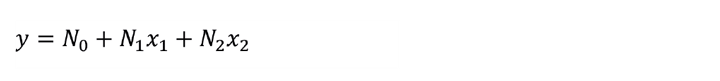

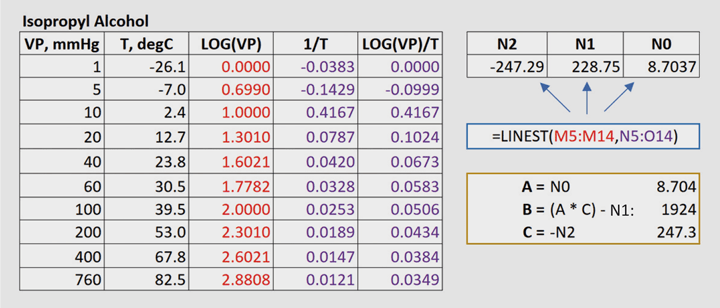
3. Use Excel’s LINEST to regress your data. In Figure 1 the known data points for at least three temperatures are listed in Columns K and L. Columns M-O compute y, x1, and x2. Highlight three cells that will return the values for N2, N1, and N0; type in the LINEST formula as shown in Figure 1. This is an array formula so you must accept it by pressing <Ctrl-Shift-Enter>.
4. Calculate coefficients A, B, and C as defined in Figure 1.
Viscosity
Liquid viscosity is an important physical parameter when evaluating fluid flow properties such as velocity, pressure drop, and shear stress. Heat and mass transfer characteristics depend upon viscosity, as do mixing parameters. Many researchers have proposed equations to calculate the viscosity of Newtonian liquids as a function of temperature. You can find parameters for viscosity equations for common liquids in the literature, or easily determine parameters if you have one or more known values.
Account for temperature change in your calculations because viscosity varies greatly with temperature. For heat transfer, the viscosity at the wall differs from the bulk liquid and the heat transfer equations incorporate this difference (which is due to the difference between the wall temperature and bulk temperature).
It is not necessary to seek the most accurate or tightest-fitting equation. Viscosity measurements themselves are subject to errors due to the design of various types of viscometers, the technician’s technique, the purity of the substance being measured, and, for some materials, the fact that shear stresses imposed by the instrument change the viscosity. In addition, an error of a few percent in the viscosity values used in your engineering calculations is very unlikely to change the conclusions that you draw from those calculations.
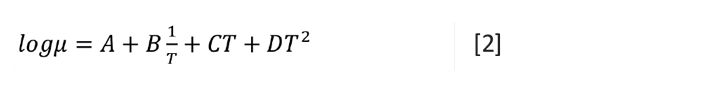
More than 30 equations have been proposed to model viscosity. Nearly all include exponential functions, and they all do a good job of charting the data. Carl Yaws published many articles and books that compiled viscosity data. He used a four-factor equation (Equation 2) and that is one that I am using for this article. You need at least four data points to determine the coefficients for the Yaws equation. The units are mPa-s and K. Multivariate regression, similar to the Antoine equation regression, finds the best values for the coefficients.
I created a VBA Function “YawsVisc(knownViscs, knownTemps, TargetTemp)” that returns the four coefficients. (See Listing 1 at the end of this article to copy and paste this code). This is an array function that is entered into the Excel worksheet by pressing <Ctrl><Shft><Enter>. You can also add the optional TargetTemp parameter in which case the function returns the calculated viscosity at that temperature instead of the coefficients.
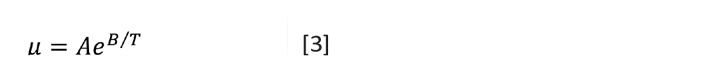
The simpler Andrade equation (Equation 3) was first proposed over 100 years ago and it is often used for liquids because of its simplicity and good agreement with data. You only need two data points to determine the coefficients; with more data use linear regression to find A and B. I created a VBA Function “AndradeVisc(knownViscs, knownTemps, TargetTemp)” that returns A and B (See Listing 2 at the end of this article). This is an array function that is entered into the Excel worksheet by pressing <Ctrl><Shft><Enter>.
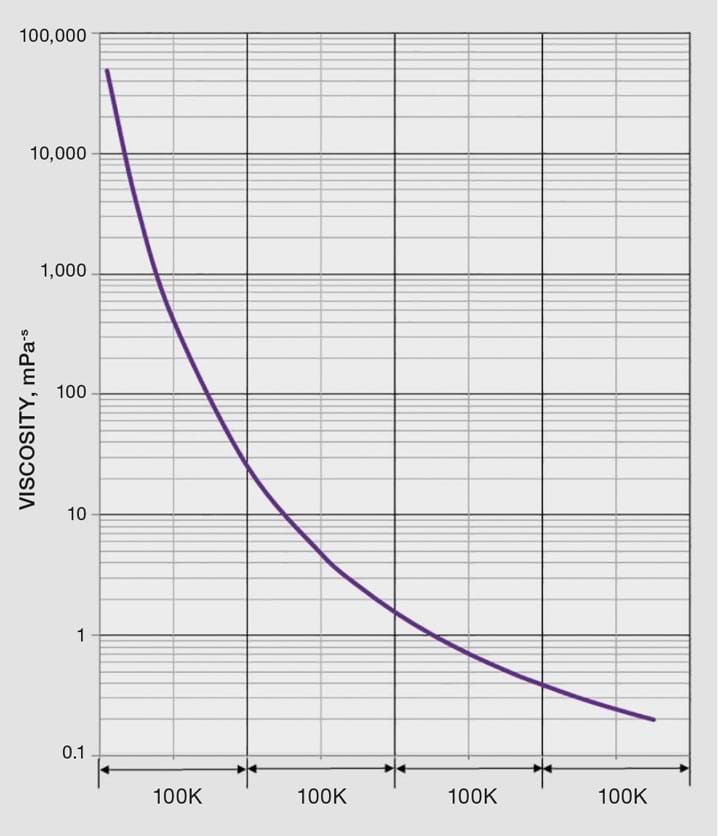
If you have only one reference value, you can estimate the viscosity at other temperatures with the Lewis and Squires chart (Figure 2). Enter the chart from the y-axis at your known viscosity. Drop down to the x-axis. Mark that point with your known temperature then move left or right by the difference between your known temperature and the desired temperature. Then read the new viscosity using the curve. Listing 3 ( available at the end of this article) is a VBA subroutine that returns the viscosity at a new temperature when given the known viscosity and temperature.
Recent Editions
Catch up on the latest news, views and jobs from The Chemical Engineer. Below are the four latest issues. View a wider selection of the archive from within the Magazine section of this site.


