Modelling with Excel Part 1: Introduction
Stephen Hall introduces a series on how to use Excel for project engineering. Download the interactive workbook to experiment with as the series develops
You may notice from the Rules of Thumb articles I have been writing that I often incorporate in my work calculations that I develop in Microsoft Excel and its scripting language Visual Basic for Applications (VBA). Engineers have many powerful software platforms and programming languages available such as MATLAB, Aspen and Python. I personally use Excel whenever it is capable of solving my problems. It is seemingly installed on everyone’s computer, there is a huge support community, it handles inputs and outputs through a simple interface (ie no programming) and it is fun to use.
Today, and in the coming months, I will risk receiving an onslaught of reader commentary in the interest of providing a practical framework for using Excel in a project engineering context. I will highlight best practices, provide examples and give instruction. I already assume that engineers are familiar with Excel and use it nearly every day; many of you are fluent in VBA or at least have a passing understanding. Many readers are firmly entrenched in how they design and use spreadsheets and they may not be receptive to my ideas. Therefore, I request your indulgence as I navigate a path that is somewhere between condescension and obfuscation.

Simulation and modelling
My reference to ‘simulation and modelling’ for this article is a tease. We will get there in due course, as the series develops, but let us start with some housekeeping. I tend to use the terms simulation and modelling interchangeably, but when pressed I make a clear delineation. Modelling is where a unit operation or process unit is depicted, usually in mathematical terms, in a mostly static configuration. It is a snapshot in time with heat transfer, flow hydraulics, mixing, vapor-liquid equilibrium or other parameters calculated. A model may incorporate stepwise calculations such as those needed to construct a system curve and thereby predict the flowrate from a centrifugal pump.
Simulation is similar, which is why I use the terms synonymously, but strictly I consider simulation as a model that shows results over time – a simulated timeframe – such as through a batch or over the course of weeks or months. Rather than give a static answer, in a simulation, parameters change either in response to the system design or due to external factors.
My ‘TankJkt’ spreadsheet is an example of a model that can also be used to perform simulations. You can download a PDF showing examples at www.pipesizingsoftware.com
The user inputs physical data such as tank dimensions, jacket and coil parameters, and agitator type and size. They also enter chemical data such as the temperature for a given heat transfer fluid (HTF) and properties for the contents of the tank. The model calculates heat flux from the jacket and coil to the tank and environment from the user’s entries for mixer speed and HTF flow rate. This gives a rate-of-change in temperature at those specific conditions. The model can also be used to simulate a tank being heated or cooled over time. The model constructs a simulated heating or cooling curve by successively substituting a new input temperature for the tank contents at specified time intervals and assembling the results in a table. If the tank starts at 20°C and the rate of heating computes to 1°C per minute, the model enters 25°C into the tank temperature at time 5 minutes. It recalculates the flux; if it now finds the rate to be 0.95°C per minute it substitutes 25 + 0.95(5) = 29.75°C at time 10 minutes. That cycle repeats until the final temperature is reached.
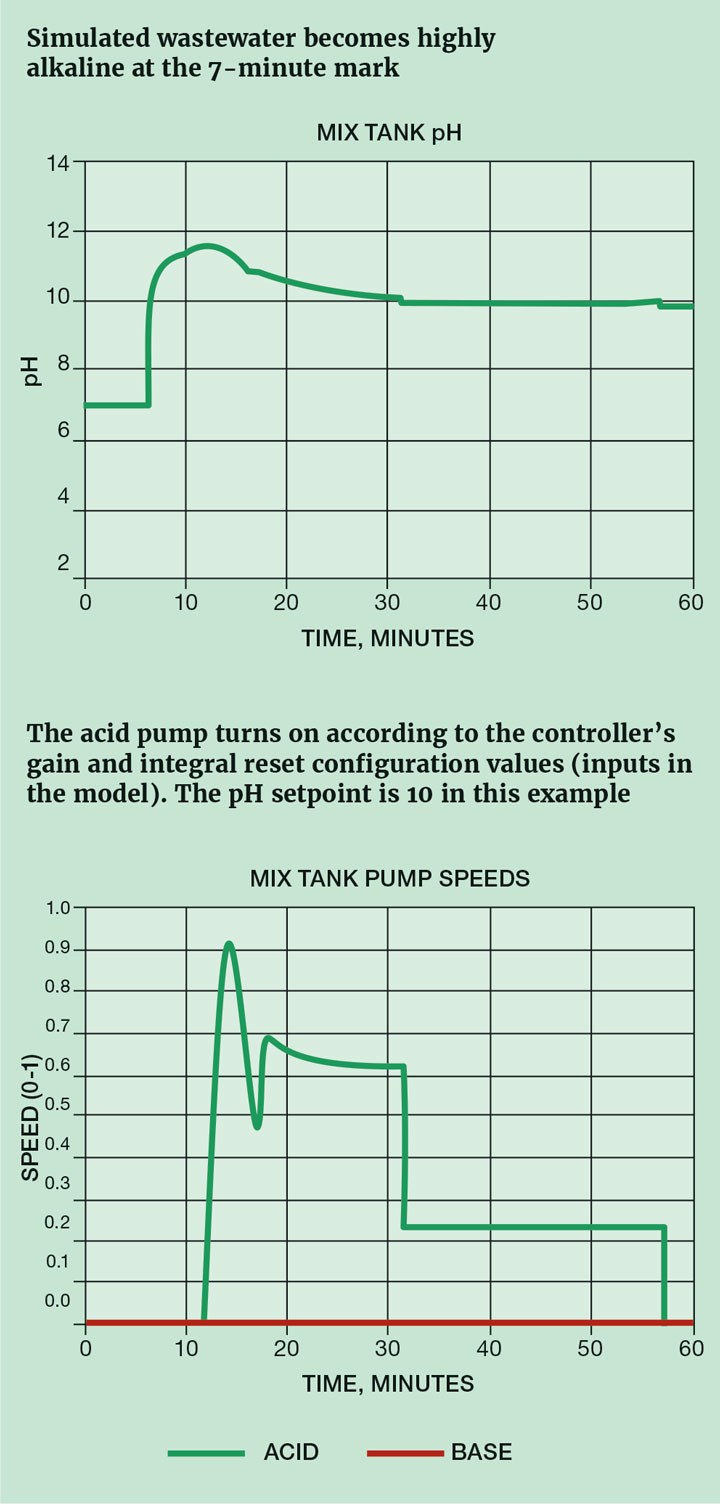
In Excel you can simulate a continuous wastewater neutralisation system with a proportional-integral-derivative (PID) controller model. In this system an acid and a base are added to neutralise the contents of a wastewater tank. See Figure 1a. The user configures the model by entering the PID control parameters and the initial conditions of the system (pH in the neutralising tank, pH and flow rate of the incoming wastewater). The spreadsheet calculates the acid or base flowrate based on the deviation from a setpoint. This is done in a large table. The first row gives the starting conditions and the next row steps forward by a user-defined time increment, for example by 1 second. It recalculates the pH in the tank from the incoming streams and repeats the PID computation.
The neutralisation simulation is spiced up by incorporating changes in the wastewater stream pH and flow rate over time. Perhaps a particularly caustic discharge occurs for 30 seconds every 10 minutes; this would be layered into the table and the model will respond when those rows are encountered in the calculation.
Documenting the work
Before you set about creating a model in Excel, in my experience it’s best that every workbook include these elements:
- A title: I usually provide a title on every sheet that indicates the purpose of that sheet, and a “Home” worksheet that gives the title of the project. To help with readability, I make the title stand out a bold size 18 font and I reserve Column A (at width = 2) and Row 1 for white space. My title is at Cell B2.
- The author’s name: Place this beneath the project title and provide contact information if applicable. You can hyperlink the name to an email address or webpage.
- The current date and revision number. Revision numbers should be updated when the project is released for use, not necessarily with each interim working version. But it is helpful to update the date because you may need to compare versions or you might want to know that you are working with the latest revision.
- Other associated information such as a project number, client name, etc.
- The purpose for the workbook and worksheet: This can be a sentence or paragraph that establishes what the model or worksheet is intended for and defines its scope. You should update this when you add new features or capabilities. I usually format the text so it fits within the margins of a printed page and use multiple rows for the text. Do not merge cells or wrap the text because it will get messy when you later insert new columns or change column widths.
Organising the work
Models often grow to gargantuan proportions. That is why logical and clear organisation is important. Whether you will be the only user or if the model will be widely shared, the project’s structure will determine its usability and maintainability.
One reason for using Excel is that the input/output canvas – the spreadsheet – is already programmed and ready for configuration and customisation. Excel’s formatting tools can produce nearly any look and feel that you desire. Harness this power to help the user by placing inputs into related groups, organising the groups into sequential workflows and providing commentary that describes what to enter and how the programme uses the information.
Use Excel’s three-dimensional structure. A workbook is composed with worksheets (or simply, sheets). Each sheet has rows and columns (2D) with the collection of sheets stacked to make the workbook (3D). Your simulation project should have sheets that are dedicated to instructions, inputs, data, calculations, and output. Establish layouts for those sheets that may be printed or displayed. Calculation sheets can use thousands of rows and columns as needed; you probably won’t consider printing them. But you are likely to print inputs, assumptions and outputs for documentation, reports and presentations. Make it easy by separating these printable elements onto dedicated sheets and format those sheets as you go.
I usually advise against using multiple workbooks for a model because doing so constrains the model’s portability. You could create a workbook for all of your physical property data and reference that workbook from all of your models. That is a great concept and may be worth considering. But it means that to share your model you must also share the referenced workbook. References to the external properties workbook may then need to be updated to provide the new file path. If the referenced workbook is maintained in a static location on your company’s server, connection may be lost if you open the model while traveling unless you have a VPN path to the server.
Keeping to-do lists and histories
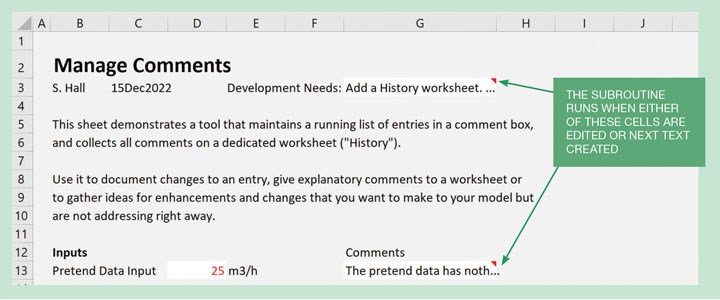
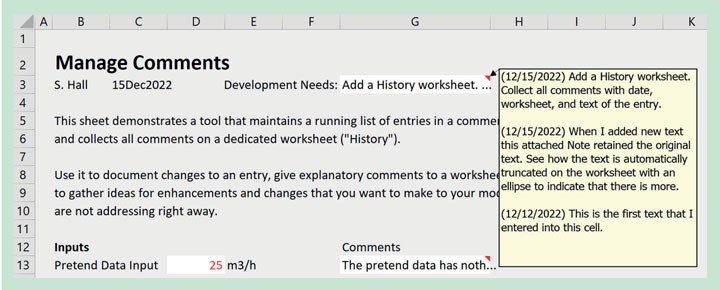
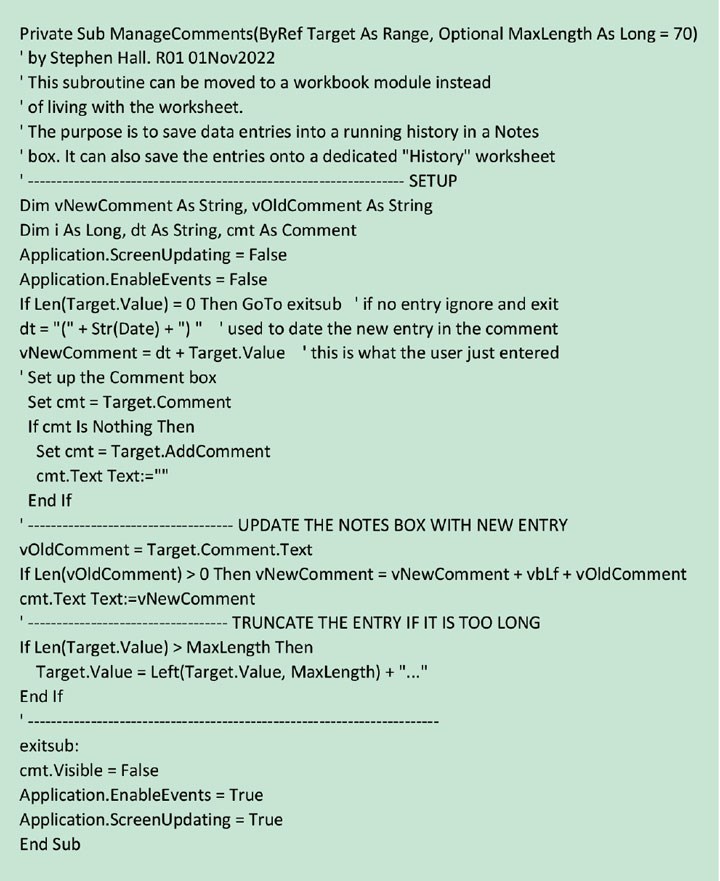
Here is a fun VBA subroutine that gives an easy way to capture notes as you develop a model or manipulate the inputs. When text is entered into either of the cells shown in Figure 2 it is added to a note that is attached to the cell. If the text is longer than the cell width the displayed text is truncated while keeping the entire entry in the note. Hovering over the cell brings up the entire note (see Figure 3).
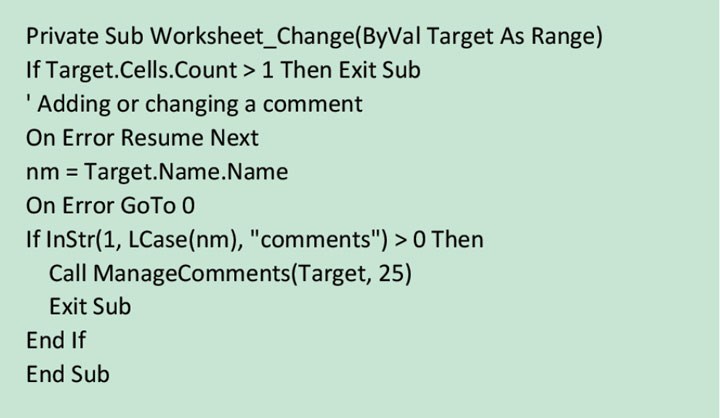
The routine has two parts:
1. It detects that the designated cell has been edited (see Listing 1). Cells are designated by giving them a name that contains the word “Comments”
2. It creates the attached note (see Listing 2). A third function can also be added that will keep a running list of the entries in a table on a worksheet (see Downloadable content).
Being the Excel expert
Excel’s power seems limitless. There are usually multiple ways to accomplish a task. Whether you use the spreadsheet’s built-in functions (which is preferred) or supplement those functions with VBA programming you can accomplish nearly anything. Use internet searches to find answers to your technical “how-to” questions. I will discuss structures and tasks that I use to build models in this series of articles, but this is far from an exhaustive treatise. Your imagination, my inspiration and the internet community are the tools you need to become an Excel guru.
Downloadable content
I have created an Excel workbook that you can download, interact with and edit as this series develops. The Home sheet in the workbook serves as a contents page and includes further useful links, including how to get started with VBA. To download this Modelling Examples interactive workbook, visit: https://bit.ly/ModellingWithExcel
This is the first in a series that provides practical guidance on using Excel for project engineering. Download the companion workbook from https://bit.ly/ModellingWithExcel
To read the rest of the articles in this series, visit the series hub at: https://www.thechemicalengineer.com/tags/modelling-with-excel
Disclaimer: This article is provided for guidance alone. Expert engineering advice should be sought before application.
Recent Editions
Catch up on the latest news, views and jobs from The Chemical Engineer. Below are the four latest issues. View a wider selection of the archive from within the Magazine section of this site.