Misleading Metrics?

How can the oil majors best measure energy transition and routes to net zero?
IT HAS been encouraging to witness many oil and gas majors sign up to the energy transition and net zero. Repsol, BP, Total, Shell and Equinor have all outlined their strategies. Common themes amongst the major operators are operational energy efficiency; a shift from oil to gas; hydrogen; renewables; biofuels; CO2 sinks (land use); and CCS.
I have always considered Norway to be best in class when it comes to environmental management. It is therefore not surprising that Equinor claims to have the best metric for operational energy efficiency. Equinor’s Climate Roadmap includes the chart in Figure 1.
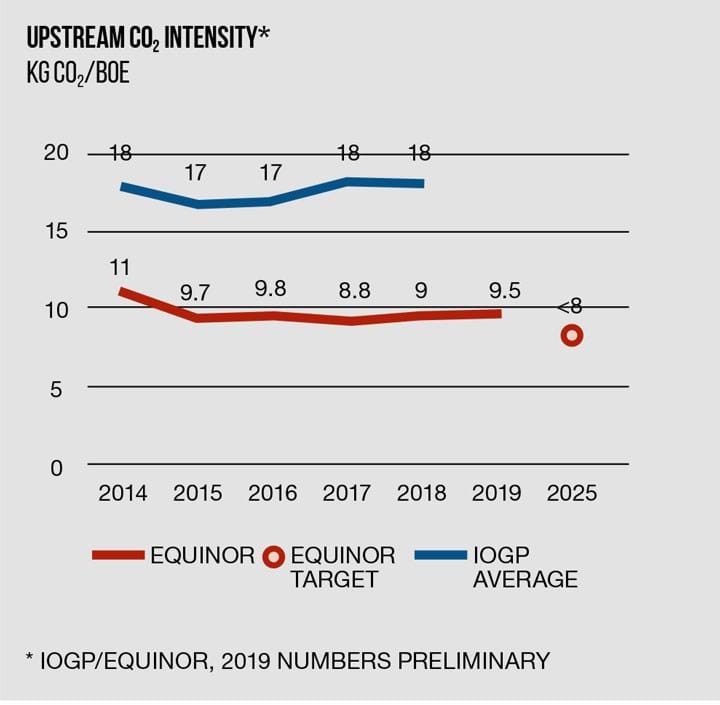
In its Climate Roadmap, Equinor also states that: “Equinor already has one of the industry’s lowest upstream carbon intensities and aims to reduce this further. We are moving forward the 2030 ambition of <8 kg CO₂ per barrel of oil equivalent (boe) to 2025. The current global industry average is 18 kg CO₂/boe (IOGP).”
Context
My series of Energy Saviours articles in The Chemical Engineer (Part 1, Part 2, and Part 3) are testament to my interest in achieving improvements in the kg CO₂/boe metric. However, it is important that this metric is put into context.
Firstly, if a barrel of oil is used as fuel, the associated emissions will be around 400 kg CO₂. Hence it is clear that reducing the amount of oil used as fuel will have a much larger impact towards achieving net zero than improvements in operational energy efficiency.
Secondly, the average global industry metric of 18 kg CO₂/boe makes no recognition of the type of hydrocarbon field and the field timeline. This is particularly the case for oil fields where it is common that dry oil is produced in the first few years followed by oil production being displaced by an increasing quantity of water. Towards the end of an oilfield’s operational life, many wells will be flowing with 5% oil and 95% water. Moving water in upstream operations is highly energy intensive.
What about upstream?
Using average kg CO₂/boe can be misleading when quantifying the energy efficiency of an upstream asset.
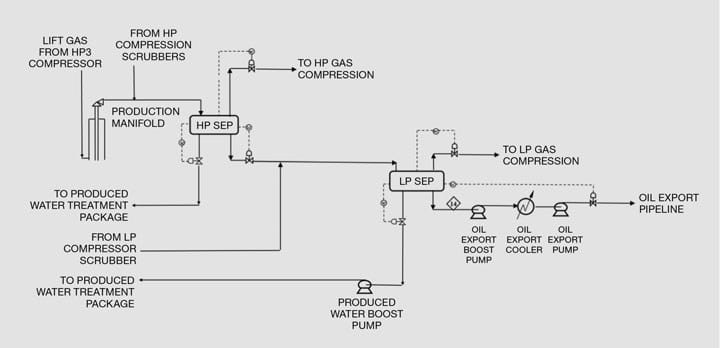
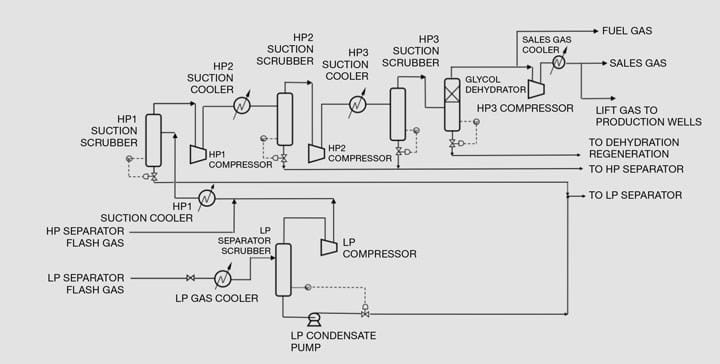
Consider, for example, a typical oil field conditioning oil and gas for onward transportation. Oil, gas and water are separated in gravity separators, the liberated gas is compressed in stages, at each stage the gas is cooled and condensed hydrocarbons are recycled to the gravity separators. To meet specifications to transport the gas, it is normally dehydrated to avoid corrosion and hydrate formation within the gas transportation network. [Hydrate crystals can form within pipelines, when water and gas combine under low temperature and high pressure conditions, and lead to blockages.] Dehydration systems typically use glycol as a water absorbent, with the glycol requiring regeneration; regeneration energy is needed to remove the absorbed water from the glycol.
Oil from the separators is typically pumped to an onshore terminal across distances which are often hundreds of kilometres, so pumping energy requirement is often significant.
The water from the separators is treated to allow for disposal to sea or reinjection back into the reservoir.
To maximise hydrocarbon recovery, oil fields normally use waterflood, where water is injected into the rock structure to push and sweep oil to the production wells. Large volumes of water are required at pressures often in excess of 150 bar (15,000 kPa). Thus water injection is also an energy-intensive process. As an example, the Chirag Field in Azerbaijan has four 27 MW pumps capable of injecting 1m bbl/d of water at 480 bar.
Furthermore, as water breaks into the production wells, hydrostatic forces in the well are increased, thus constraining oil production. To minimise the effect of increasing well hydrostatic head it is common oilfield practice to inject gas into the production tubing to lower the density of the fluid. This is known as gas lift. Gas lift rates increase with increasing water production, and compressing the required lift gas is energy intensive.
Process flow diagrams (PFDs) of a typical oilfield separation and gas handling process are shown in Figures 2 and 3, respectively.
From A to B
Consider two identical oilfields (Field A and Field B) designed for 100,000 bbl/d of oil at differing operational timelines.
Field A is at year 2, where oil is at design rates and water is not being produced with the oil. Gas production is 1.7 x 10⁶ Nm3/d – 9,600 boe/d. Water injection rates are 120,000 bbl/d.
Field B is at year 20, where oil production rates have dropped to 10,000 bbl/d with produced water rates at 130,000 bbl/d. Gas production is 960 boe/d. Water injection rates have increased to 150,000 bbl/d. The gas compression rate is the same as Field A but much of the gas is used to provide gas lift.
Both fields use associated gas in gas turbines to generate electricity for the major energy users.
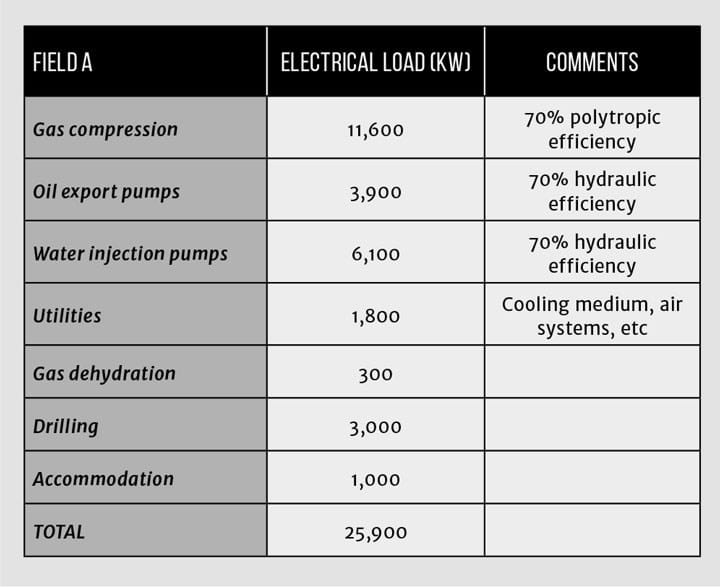
Field A
Field A’s load list is shown in Table 1.
Power generation
Field A is powered by single cycle gas turbines at 35% efficiency. The fuel is taken from the gas plant.
For the given load list the energy efficiency metric for the power generation plant is calculated as 3.2 kg CO₂/boe.
Flare
Field A has an average flare rate of 28,000 Nm3/day.
The corresponding metric is 0.7 kg CO₂/boe.
Hence the combined emissions metric for Field A is 3.9 kg CO₂/boe.
On the face of it, this is a very good metric compared to the industry average of 18 kg CO₂/boe. Note that oil fields where no water is being produced generally exhibit very good metrics.
Field B
Field B’s load list is shown in Table 2.
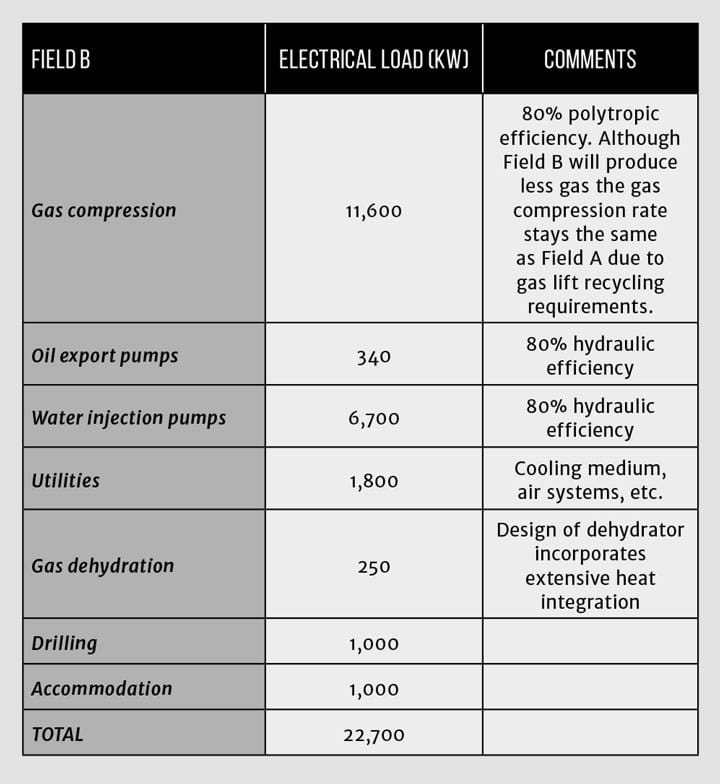
Power generation
Field B is powered by combined cycle gas turbines at 50% efficiency.
The energy efficiency metric is calculated as 19.4 kg CO₂/boe.
Flare
Field B has a flare gas recovery system and average flare rate is much lower than Field A, at 14,000 Nm3/d.
The corresponding metric is 3.5 kg CO₂/boe.
The overall emissions metric for Field B is 22.9 kg CO₂/boe.
Comparing Field A to Field B it is clear that Field A has a substantially better kg CO₂/boe metric. However, Field B has deployed superior energy efficiency plant when compared to Field A – combined cycle generation, more efficient rotating equipment, flare gas recovery and more heat integration.
It is therefore clear that the kg CO2 /boe overall field metric is not presenting the energy status of Field B. The metric is very misleading with respect to oilfield energy efficiency performance, particularly in mature fields producing large quantities of produced water. The UK is a mature oilfield province, and hence many operating fields are producing oil together with high volumes of produced water. Whilst UK fields may be operating efficiently from an energy standpoint they will not score well using the overall energy metric of kg CO2 /boe.
Like-for-like
To compare operational oilfield facilities on a like-for-like basis requires examination of the level below the overall metric. This would involve comparing the energy performance of the main unit operations – gas compression, gas treatment, pumping, power generation. A unit operation approach would be a far truer reflection of operational energy efficiency, for example, by using demand-side metrics such as kW/kg of water removed for gas dehydration, and kw/bar per m3/s for pumps and compressors. The supply-side gas turbine metric would simply be thermal efficiency.
As a footnote, it is no surprise that the most energy-efficient action that can be taken for upstream operations is to deploy combined cycle power generation. Until now, combined cycle offshore plant has been avoided due to cost and complexity. Recognising the oil majors’ net zero plans, it will be interesting to see how many new offshore oilfields will incorporate combined cycle power generation.
Recent Editions
Catch up on the latest news, views and jobs from The Chemical Engineer. Below are the four latest issues. View a wider selection of the archive from within the Magazine section of this site.