Materials Utilisation
Malcolm Wilkinson and colleagues discuss the importance of materials efficiency in the fight against the climate crisis
ACHIEVING zero-carbon is a challenge and an opportunity to the engineering community in general, and chemical engineers in particular. Chemical engineers will play a crucial role in the design of pathways to decarbonise processes in energy-intensive sectors, notably power, heavy industry, including chemicals, and transport and to a lesser extent in buildings and agriculture. A key element in this challenge is a massive reduction in waste production coupled with the more effective – as opposed to merely more efficient – use of planetary resources. The Sustainability Special Interest Group (SSIG) has prepared a series of thought pieces1,2,3 on achieving zero carbon; this, the fourth and last, covers the issue of waste reduction, materials effectiveness and the circular or performance economy.
Introduction
The UN Sustainable Development Goals (SDGs)4 expose the dichotomy between economic growth and the need to stay within ecological boundaries. Currently, global production and consumption levels are overshooting the planet’s biocapacity by about 50% each year5. In other words, we have already grown beyond ecological limits, and growth is no longer an option on a global scale. This ecological overshoot is due almost entirely to overconsumption in rich countries, particularly the West, now augmented by increasing demand from poorer developing countries. SDG8 calls for improving “global resource efficiency” and “decoupling economic growth from environmental degradation”. However, global material extraction and consumption has in fact doubled over the past 30 years6, and accelerated since 2000. This is unsustainable. Materials effectiveness, encompassing waste minimisation and a reduction in virgin raw materials use, must be drastically improved by better materials choices based on a life cycle approach specifically including design choices which extend product durabiity and the ability to repair, re-engineer and recycle at the end-of-life point.
Innovation in processes and product design will play a major role in increasing materials utilisation and the more sustainable use of resources. Tackling climate change is not about doing the things we do more efficiently and ensuring economic growth based on current measurement criteria – it requires a fundamental shift in approach, and we have to succeed in implementing this dramatic change within a 30-year time horizon.
The waste mountain
In general, waste data needs to be considered with a degree of caution because of inconsistencies in definitions, data collection methodologies, and availability. The data included here are taken from a World Bank Report on waste7.
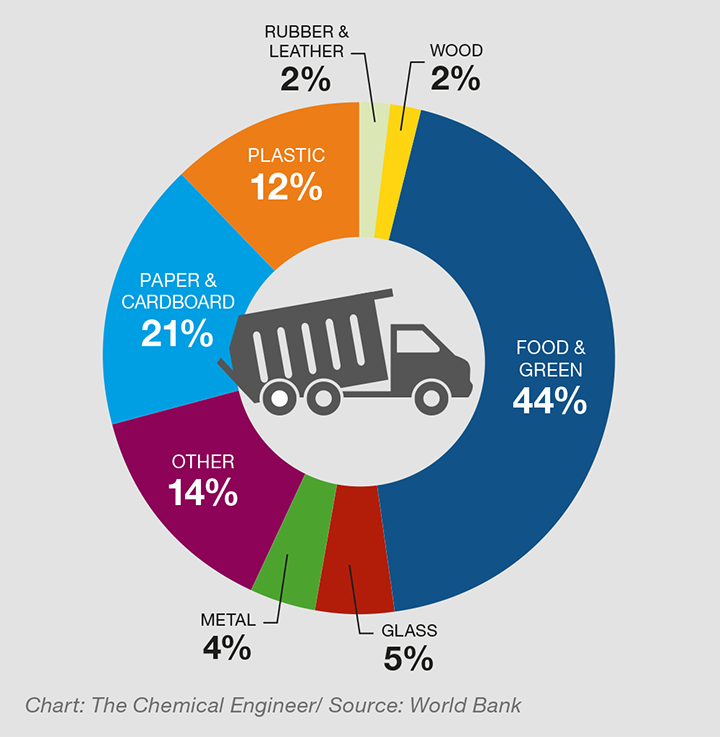
The world generates 2.01bn t/y of municipal solid waste (MSW), with a very conservatively estimated 33% that is not managed in an environmentally safe manner. Worldwide, MSW generated per person per day averages 0.74 kg but ranges widely, from 0.11 kg in low-income countries to 4.54 kg in high income countries. The composition of this stream is detailed in Figure 1. This taxonomy does not uniquely identify textiles, which have become an increasing proportion of MSW over the last decade with the advent of cheap, throw-away fashion based on exploiting cheap labour in low income economies.
Looking forward, without a significant change in approach, global MSW is expected to grow to 3.4bn t by 2050. This increase is forecast to be greater in low- to middle-income countries as they grow and develop.
Based on the volume of MSW generated, its composition, and how it is managed, it is estimated that 1.6bn t of CO2-equivalent greenhouse gas emissions were generated from solid waste treatment and disposal in 2016, driven primarily by open dumping and disposal in landfills. This is about 5% of global emissions. Solid waste-related emissions are anticipated to increase to 2.6bn t of CO2-equivalent per year by 2050 if no improvements are made.
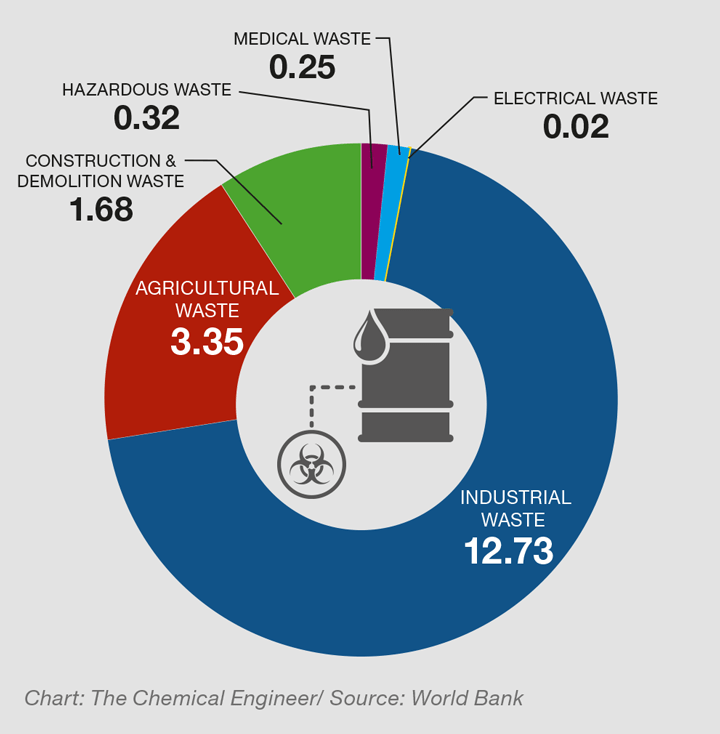
Municipal solid waste is only one of several waste streams that countries have to manage. Other common waste streams include industrial waste, agricultural waste, construction and demolition waste, hazardous waste, medical waste, and electronic (e-waste). These streams are considerably larger than MSW, amounting to almost 50bn t/y in total, broken down as in Figure 2. The treatment of these streams varies considerably depending on the prevailing economics of recovery with some industrial and construction and demolition waste competing with MSW for landfill capacity.
It is clear that solutions to waste reduction and treatment are as much political as technical. With the increased awareness of the environmental impact of wastes there is increased awareness of the value in wastes and a concerted movement to extract and realise that value from the different streams. However, with the forecast increase in waste production being concentrated in low- and middle-income countries as they develop, financial support is likely to be required to enable them to transition.
Treatment approaches
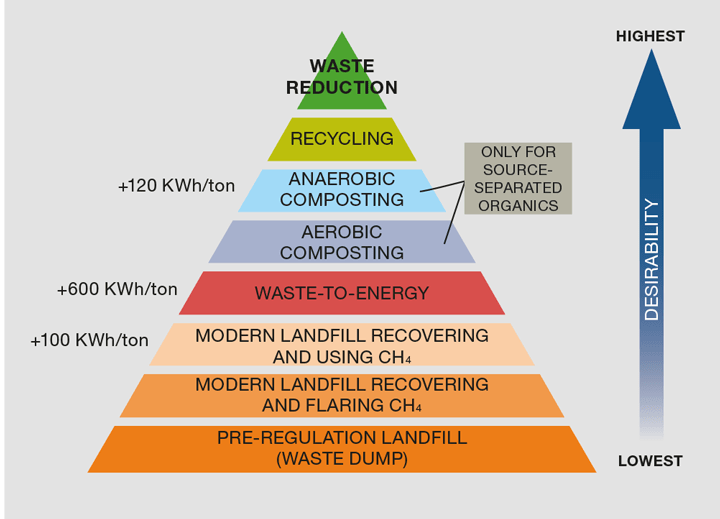
The traditional waste management hierarchy is shown in Figure 38. This hierarchy has been developed based on minimising environmental impacts of waste management procedures. The top two tiers focus on avoiding waste disposal by reducing byproducts or waste generation and reusing or repurposing materials, followed by recycling. Once reduction, reuse, and recycling have been completed, the remaining waste must be disposed of by the methods preferentially shown in the hierarchy. Composting works only for source-separated organics otherwise the contamination that results typically renders the product unusable. Anaerobic composting is preferable, because it produces methane gas that can be captured and converted to heat or electricity whereas aerobic composting produces CO2. Waste that cannot be sufficiently separated and decontaminated can then be processed via some form of thermal conversion which may be as simple as combustion (with or without energy recovery) or very sophisticated gasification and conversion into synthetic fuels. The waste-to-energy industry worldwide has demonstrated the safe, reliable use of combustion systems, as well as continually improving and developing new technologies, such as gasification, pyrolysis, and plasma processes, to produce myriad products from post-recycle waste streams. The final option is landfill.
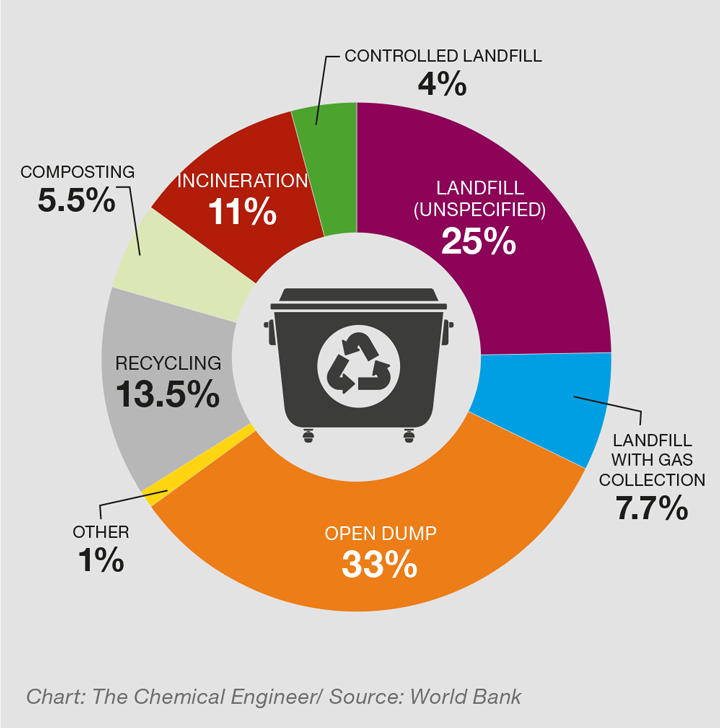
How waste streams are treated depends largely on the income level of the country in question. Adequate waste disposal or treatment, such as recycling, controlled landfills or more stringently operated facilities, is almost exclusively the domain of high- and upper-middle-income countries. Lower-income countries generally rely on open dumping with 93% of waste dumped in low-income countries and only 2% in high-income countries. The export of waste from high-income to low-income countries, often misleadingly recorded as recycling, is a growing issue. The treatment methods for MSW are detailed in Figure 4.
Globally, about 37% of waste is disposed of in some type of landfill, 33% is openly dumped, 19% undergoes materials recovery through recycling and composting, and 11% is treated through modern incineration.
A new approach
The waste mountain arises because the industrial economy is mainly a linear once through system and this has dominated business in the industrialised countries since the industrial revolution. In the linear economy, the focus is on the management of throughput flows. The performance of an industrial economy is judged by measuring the sum of all economic flows, the gross domestic product (GDP), by calculating the value added to these flows. Typically, its optimisation stops at the point of sale where the responsibility for operating and disposing of the goods is passed to the buyer. The linear economy incentivises ever greater resource consumption and waste production and in a crowded planet it is ultimately unsustainable.
A new approach, now gaining ground, and called the circular economy is based on value preservation, as opposed to value added. The basic elements are shown schematically in Figure 59.
The reuse loop includes second-hand markets (from garage sales and flea markets to eBay) as well as commercial and private reuse of goods (eg refilling of beverage containers, reuse and resale of garments). These activities are usually carried out locally. Loop 1, labelled remanufacturing, includes repair, remanufacturing and “upgrading” to meet new technological standards or to meet new fashion expectations. Remanufacturing may be a local activity (eg refurbishing of domestic appliances or cars) or may be carried out via regional service centres. Loop 2 represents recycling in which, rather than repairing or reusing manufactured goods and components, the product is reprocessed to recover secondary materials for return to the same use. Reprocessing may be a regional activity or may be part of a global supply system. Reprocessing includes operations such as recycling of paper and plastics, re-refining of fluids such as lubrication oils and, where practical, depolymerisation of polymers. Some end-of-life goods and materials may go to other uses, such as export for reuse in other locations or “cascading” into lower-specification applications (downcycling) including energy recovery, or may leak from the economic system as waste.
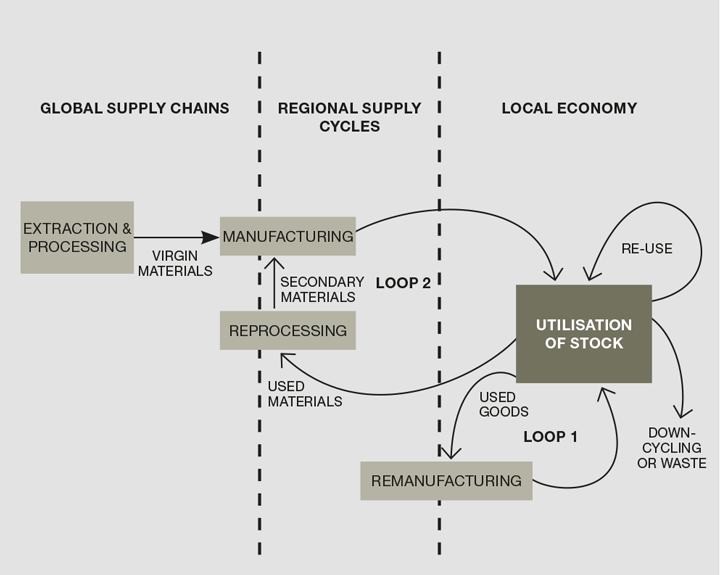
There are a number of variants in the application of circular economy principles. At its simplest (but also least profitable and materially efficient), the circular economy takes the form of Loop 2 in Figure 5 being focused on recycling in which the material of the product is not lost as waste but is reprocessed for return to the same use. In this concept the ownership changes in each part of the loop, each owner aiming to achieve the highest profit when passing on material goods.
A development of this model focuses on value preservation based on optimising the use of the stock through stewardship without changes in ownership. The actors in such a concept operate a portfolio of similar goods, such as the vehicles of haulage companies, and maintain the components in their portfolio (eg engines and tyres in the case of road vehicles). These owners may have their goods repaired or remanufactured by independent service companies. Owners focus on managing the stock rather than the flows maintaining ownership of their stock and therefore profiting from the economic advantages of reuse and remanufacturing strategies.
A further variant is illustrated by companies selling performance, through business models such as “goods as services” or “molecules as services”, which means earning revenue and profits from the use of stocks. They have shifted their focus from supplying the stock, to maximising the value obtained from using the stock. This is the “performance economy” which considers waste and loss prevention at all stages in the product cycle from design to decommissioning. Designing products for recycle makes their reuse (either whole as components or as materials) very much easier and more economic.
Conclusion
The performance economy focuses on the maintenance and exploitation of stock rather than linear or circular flows of materials or energy. Its key elements are reuse and remanufacturing to maintain the quality of stock and extend its service life. As a result, the virgin material flows required to create products are greatly reduced. Working in the performance economy the chemical engineer of the future will have to be far more aware of the significance of material flows, the potential sources of waste and the need to design and manufacture products for reuse and remanufacturing with the objective of keeping them in service for as long as possible. Reuse and remanufacturing tend to be more labour-intensive and less capital-intensive than virgin material production or primary manufacturing. This enables the substitution of labour for energy, reversing the trend which has characterised industrial economies and offering ways to alleviate current environmental, economic and global challenges. This makes the economy more sustainable in all its facets by also addressing the social issues arising from current trends of automation to increase labour productivity at the expense of employment. Clearly there are significant barriers to adoption of the performance economy model, partly because current economic and business models focus on flows (GDP or added value) rather than prioritising the quality, value and use of stock. Promoting the performance model requires different incentives and penalties in the supply of goods and services. A complete rethink by governments of public policy and by corporations of business models is urgently needed but the debates necessary to achieve this have hardly begun.
References
1. The Chemical Engineer, May 2021, Issue 959 pp54-57.
2. The Chemical Engineer, June 2021, Issue 960 pp42-45.
3. The Chemical Engineer, July 2021, Issue 961 pp42-46.
4. UN Sustainable Development Goals, https://bit.ly/3BWPtN8
5. National Footprint Accounts, Global Footprint Network, 2016, www.footprintnetwork.org/resources/data.
6. Giljum, S et al, Global Patterns of Material Flows and their Socio-Economic and Environmental Implications (2014), https://bit.ly/3zMrxu2.
7. What a Waste 2.0, A Global Snapshot of Solid Waste Management to 2050, World Bank Group (2018), https://bit.ly/3rKOIlz
8. Castaldi, MJ, Perspectives on Sustainable Waste Management, Ann Rev Chem Biomol Eng, 2014, 5:547–62.
9. Stahel, WR and Clift, R, Stocks and Flows in the Performance Economy; in Taking Stock of Industrial Ecology (2016); https://bit.ly/3xiszMK
Recent Editions
Catch up on the latest news, views and jobs from The Chemical Engineer. Below are the four latest issues. View a wider selection of the archive from within the Magazine section of this site.

