How to Use Bow Tie Diagrams
Bow-tie diagrams can extract valuable information from HIRA reports and make good use of it in ongoing process safety management
"Safety seems so easy – just make sure people don’t get hurt. In practice it is a lot harder to achieve a safe organisation that is capable of sustained safe performance in the face of significant hazards."
Patrick Hudson, Leiden University
In my last contribution to this How to series (issue 909), I discussed hazard assessment, and explained that the main purpose of this is to understand the cause-consequence pathways, and for major accidents, how bad the consequences can be. It is the progression along the pathway from cause to consequence, and the identification of safeguards needed to prevent this progression, that we are trying to understand when undertaking a hazard assessment.
Once we understand the potential hazards the obvious question to ask is: “Are the safeguards we have identified sufficient?” The next step, therefore, is to conduct risk assessments and ensure that we have enough safeguards and that they are reliable enough. The LOPA technique (issue 899) is a commonly-used approach to help answer these questions, and results in a set of defined independent protection layers (IPLs).
Most commonly, this process is followed for projects, whether these are greenfield or brownfield. The information from the hazard identification and risk assessment (HIRA) is used to inform the final design of the plant.
Bow-tie diagrams...can extract the relevant information from the HIRA reports, and present it in a form that can be used in the plant’s risk management system
Unfortunately, my experience is that this information often goes no further. Once the reports have been used to facilitate safe design of the plant, they are seen to have served their purpose and often end up on a shelf in a project office, or in an archive somewhere. This is a waste, as clearly this information is valuable, and many hours of work have gone into obtaining it, so it makes sense to get as much use from it as we can.
Some companies have recognised that the information in the HIRA reports could be useful in the ongoing management of risks in the process over its lifetime. The problem is that the information is locked in long reports and, frankly, the format of these reports does not facilitate day-to-day use in a risk management system.
This is where bow-tie diagrams come in. They can extract the relevant information from the HIRA reports, and present it in a form that can be used in the plant’s risk management system. In this article I will introduce the concept of bow-tie diagrams, and present some ideas as to how they can be used within an integrated process safety management system.
History of bow-ties
The exact starting point of the bow-tie methodology has been lost, but it is believed that they were originally called “butterfly diagrams” and evolved from the cause consequence diagram of the 1970s. It is thought that David Gill of ICI developed the methodology and called them bow-ties in the late 70s. It is generally accepted that the earliest mention of the bow-tie methodology appears in the ICI Hazan course notes 1979, presented at The University of Queensland, Australia.
It is fair to say that at this point the use of bow-tie diagrams, at least for the management of major hazards, was not widespread prior to Piper Alpha in 1988. After the report of Lord Cullen, who concluded that there was far too little understanding of hazards and their accompanying risks within operations, many companies began to look at their own process safety programmes and how to improve this aspect of them.
During the late 1980s and early 1990s, Shell funded research into this by Leiden and Manchester Universities. It is this collaboration that resulted in the further development of bow-tie diagrams, but also many other familiar risk management tools such as the Swiss cheese model, the Hearts and Minds toolkit, Tripod Delta & Tripod Beta, and Life Saving Rules.
Shell is acknowledged as the first major company to use the bow-tie methodology; but as the 1990s grew to a close the approach became more commonly used within many other companies. The use of the bow-tie method is now commonplace in many industry sectors including oil and gas, mining, maritime, chemical and healthcare to name but a few.
The bow-tie diagram
In my experience, much of the earlier use of bow-tie diagrams was for occupational safety risk management. It is only relatively recently that they have gained popularity in the management of major accident hazards. Because of this, the early language used on bow-tie diagrams did not readily align with the HIRA methodologies in common use for process safety management. In this article I will try and address this by using terms that are similar to those used in HIRA.
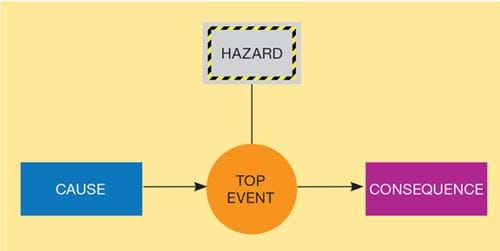
The bow-tie diagram was developed from two techniques that were commonplace at the time – fault tree analysis (FTA) and event tree analysis (ETA). In simple terms, FTA takes an event – known as the “top event” – and identifies all of the causes that could lead to this top event. ETA takes the top event and identifies the possible consequences of the event.
Clearly, both FTA and ETA have the top event in common; therefore, it is possible to join both techniques together. This gives a combined pathway which, in its simplest form, is shown in Figure 1.
I have added the hazard that is connected to the top event for completeness.
When I was discussing hazard assessment earlier, I suggested that what we were trying to do was determine the cause–consequence pathways. Clearly this is consistent with the simplified pathway in Figure 1. Recognising that a FTA has more than one cause leading to the top event, and an ETA has more than one consequence possible from a top event, the above diagram can be expanded to include multiple pathways, as in Figure 2.
Perhaps it is now clear where the bow-tie diagram gets its name!
Now we can add the ‘barriers’ that we identified in the HIRA. The use of the independent protection layer (IPL) has been used in this article as this has a particular meaning for barriers in LOPA studies, and because the LOPA process ensures that any IPL chosen is effective for the scenario.
Recent Editions
Catch up on the latest news, views and jobs from The Chemical Engineer. Below are the four latest issues. View a wider selection of the archive from within the Magazine section of this site.