Visual Hazop
Exploiting the power of bowties to improve study effectiveness and enhance engagement
HAZARD and operability (HAZOP) is a well understood, respected and employed technique in the process (and other) industries. It offers systematic rigour in challenging the design and operating intent of a new, modified, or established facility and provides a foundation for further analysis and risk assessment.
The principles have changed very little since the method was conceived in the 1960s by ICI and published by HG Lawley in 19741. A typical approach is documented in an international standard2 and more practical guidance is available from IChemE3 and the CCPS4.
Current practice uses software to record the HAZOP study as it happens, and to display the worksheet on a screen to ensure that all participants have the opportunity to view their contribution and, if necessary, correct or expand the notes.
The output from HAZOP studies either stands alone or is developed in risk assessments such as layer of protection analysis (LOPA) to qualify or quantify the risks associated with the identified hazards. Although integrated HAZOP and LOPA applications do exist, they are however limited by the quality and quantity of information or knowledge they can impart to those who were not present during the studies. It is also often the case that participants may become disengaged from a method that is wholly textual (particularly those unfamiliar with the technique).
Challenges
While HAZOP has proven to be an invaluable hazard identification tool, it does have its limitations, which have been documented (but not necessarily well publicised or acknowledged) in several industry journals and books.
Strictness
Trevor Kletz, in his book HAZOP and HAZAN5, noted: “Although HAZOP is a valuable technique, no-one jumps out of bed on a Monday morning shouting, ‘Hooray! I’ve got a HAZOP today!’ The need to consider every deviation on every line can become tedious. Beware of making it more so by bureaucratic procedures such as insisting on excessive recording or discussing everything twice (or three times) in the HAZOP meeting and afterwards with the boss or the project team. There is a net loss if, in our eagerness to document it and explain it to everybody, we discover less information worth documenting. If HAZOP and similar systems are not acceptable to creative minds, they will never succeed.”
Team burnout is a well-known phenomenon which must be managed with due consideration to project timescales, budgets and participant continuity.
Safeguards
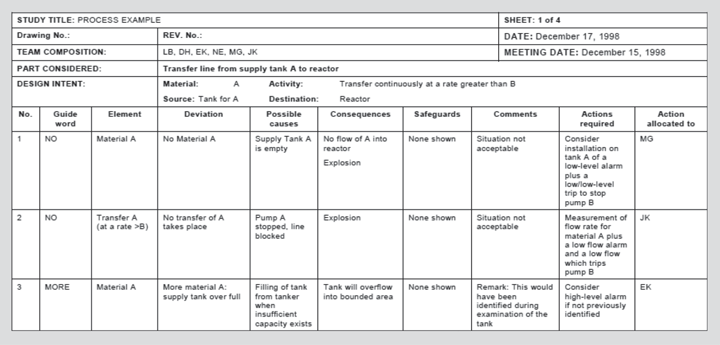
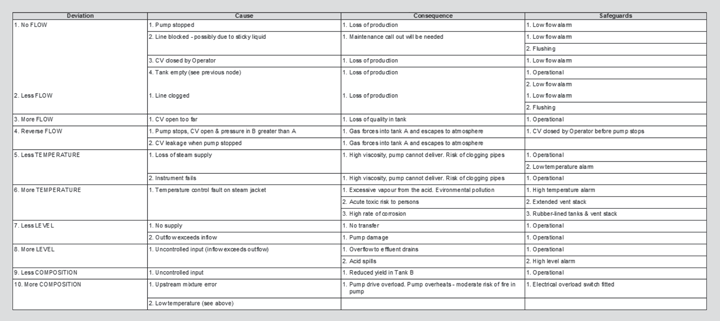
The standard2 format for a HAZOP worksheet (which is typically replicated in commercial HAZOP/PHA software tools) only includes a single column for safeguards (or existing controls according to the current version) – see Figure 1.
With only a single field to document all the prevention and mitigation measures for the cause-consequence scenario, it can be difficult to fully appreciate the balance of safeguards and their role in reducing risk by their presence and/or performance before or after the hazardous event.
Jones6 covered this and other pitfalls in the technique by noting that the HAZOP team can often give unwarranted credit to safeguards or conversely offer too little or no credit for them where it may be due – potentially as their role was not apparent. Without a comprehensive appreciation of the relative and absolute contributions made by safeguards, their criticality and therefore the maintenance, monitoring and management attention they merit is often subjective resulting in resources being deployed in the wrong areas.
Singularity
The linear, tabular nature of recording tends to focus on a single cause leading to one or more consequences and often where a separate cause is identified as leading to the same consequence, eg in a subsequent guideword/deviation discussion, then it is all-too-easy to simply record “As above” or “See above” without fully appreciating the common elements and subtle differences in such scenarios.
The HSE recognised this as a weakness in the technique. One document7 notes that “HAZOP is also weak in handling multiple cause events. Teams find difficulty in holding together and tracing through the implications of a number of failures at once”. Another report8 notes this more strongly as a distinct disadvantage, as HAZOP “focuses on one-event causes of deviation only. Only the hazards associated with single deviations can be studied. Hazards that are caused by two or more separate deviations cannot be identified by the technique.”
Another way – the visual HAZOP
In order to address the disadvantages of HAZOP noted above but ensure that suitably-proportionate rigour is applied to confirm known issues and identify unknown problems, a technique (provisionally referred to as “visual HAZOP”) is proposed which applies the guideword/deviation approach of HAZOP with the clarity of bowtie analysis.
Bowtie (like HAZOP) originated in ICI in the 1960s and first appeared in the public domain via the University of Queensland in 1979 (although its exact origin is unclear). It came to prominence after the Piper Alpha incident in 1988 when the Cullen Report9 concluded that there was far too little understanding of hazards and their accompanying risks that are part of operations, and the urge rose to gain more insight in the causality of seemingly independent events and conditions and to develop a systematic/systemic way of assuring barrier over these hazards.
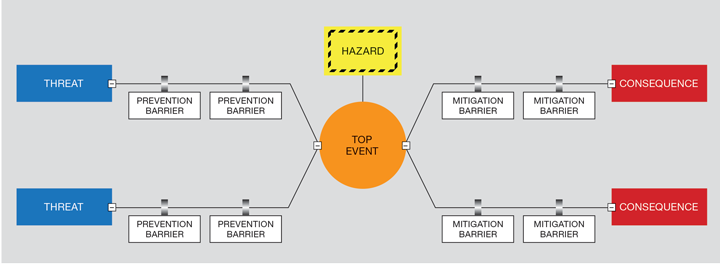
The technique is graphically summarised in Figure 2. This is read from left to right and is centred about a hazard (something with the potential to cause harm) and the top event where that hazard is realised or released. The top event may be caused by a number of threats which are prevented from escalating by risk controls in the form of barriers (technical or organisational measures), and the effects of the top event can be mitigated by risk reduction measures before the consequences occur.
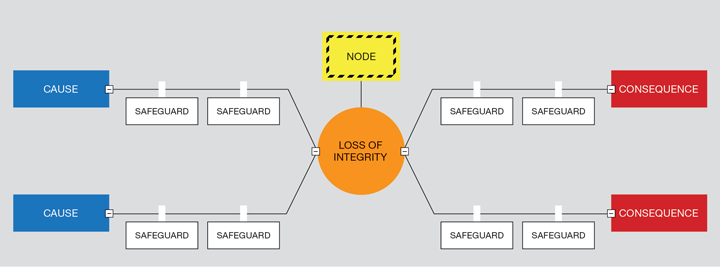
It is therefore easy to simply change the terminology used to be consistent with HAZOP, as shown in Figure 3.
The visual intuitive nature of bowties allows the risks associated with the cause/threat-consequence scenarios to be universally understood, promptly addressed, and successfully managed. This clarity helps study participants quickly develop hazard scenarios in a collaborative environment and also assists in recalling discussions several days or weeks after the study sessions have passed.
There are however a number of issues in simply swapping the terms over:
- It is not clear what deviations the cause(s) and consequence(s) relate to.
- It is not obvious which cause(s) lead to which consequence(s).
- A HAZOP node may have several different hazards associated with it.
To overcome these challenges, suitable software and an efficient HAZOP scribe are required, however since the industry should be moving towards appropriate tools and better use of limited resources, neither of these are considered to be insurmountable tasks. Arguably Microsoft Office (either as Excel or Word) is the most common HAZOP recording tool, however it does not offer the reporting, analysis and action management power of
commercially-available process hazard analysis (PHA) tools (of which there are many on the market). Similarly, bowties can be developed using conventional drawing, drafting or presentation tools, but again these formats offer little or no analytical features and there are bowtie tools available which are much better suited to ongoing barrier-based risk management.
HAZOP guidewords, “no flow” etc can be offered to the team for consideration and possible causes are documented as bowtie threats. For each cause or threat, appropriate safeguards that would prevent a loss of integrity (eg containment or control) are documented as barriers. Thereafter consequence(s) associated with that cause/threat are discussed and documented with appropriate recovery measures following the loss of integrity – again these are displayed as barriers.
The ‘conventional’ HAZOP process continues with each guideword/deviation discussed and added to the bowtie diagram. Where the same cause arises during discussions of another guideword/deviation then it is recorded as the same threat but can be annotated with another deviation, eg a closed valve can lead to “no flow” and also “more pressure” (upstream) or “less pressure” (downstream).
Where deviations are not applicable, causes are not credible, or consequences are not significant, these can be recorded as such to provide full recording.
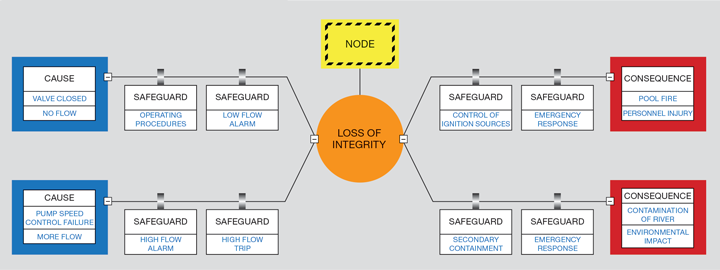
As the bowtie develops, the relationships between the components are captured (by the scribe whilst the discussion continues) and these can be used for analysis inside or outside the review meeting, similar to the simple example in Figure 4. Barriers identified which do not yet exist can be colour coded or highlighted as bowtie actions, and diagram filtering is used to focus on scenario components or specific cause-consequence relationships.
Although it is possible to convert HAZOP worksheets into bowties (these are most effective when safeguards are separated into prevention and mitigation measures) arguably any discrepancies, eg missing or misplaced safeguards, need to be revisited by returning to the HAZOP and resuming the discussions. By developing the bowtie as the discussions evolve (hence the need for an effective scribe) such rework is avoided.
An enhanced HAZOP methodology approach is therefore suggested which exploits the immediate efficiency of scenario development plus the long-term knowledge retention that a simple but
effective graphical representation offers. Bowties and worksheets can be easily interchanged to assist in the transition between primitive worksheets and a more advanced representation.
Example
Consider the transfer of acid from vessels A to B – the HAZOP worksheet might look something like that shown in Figure 5.
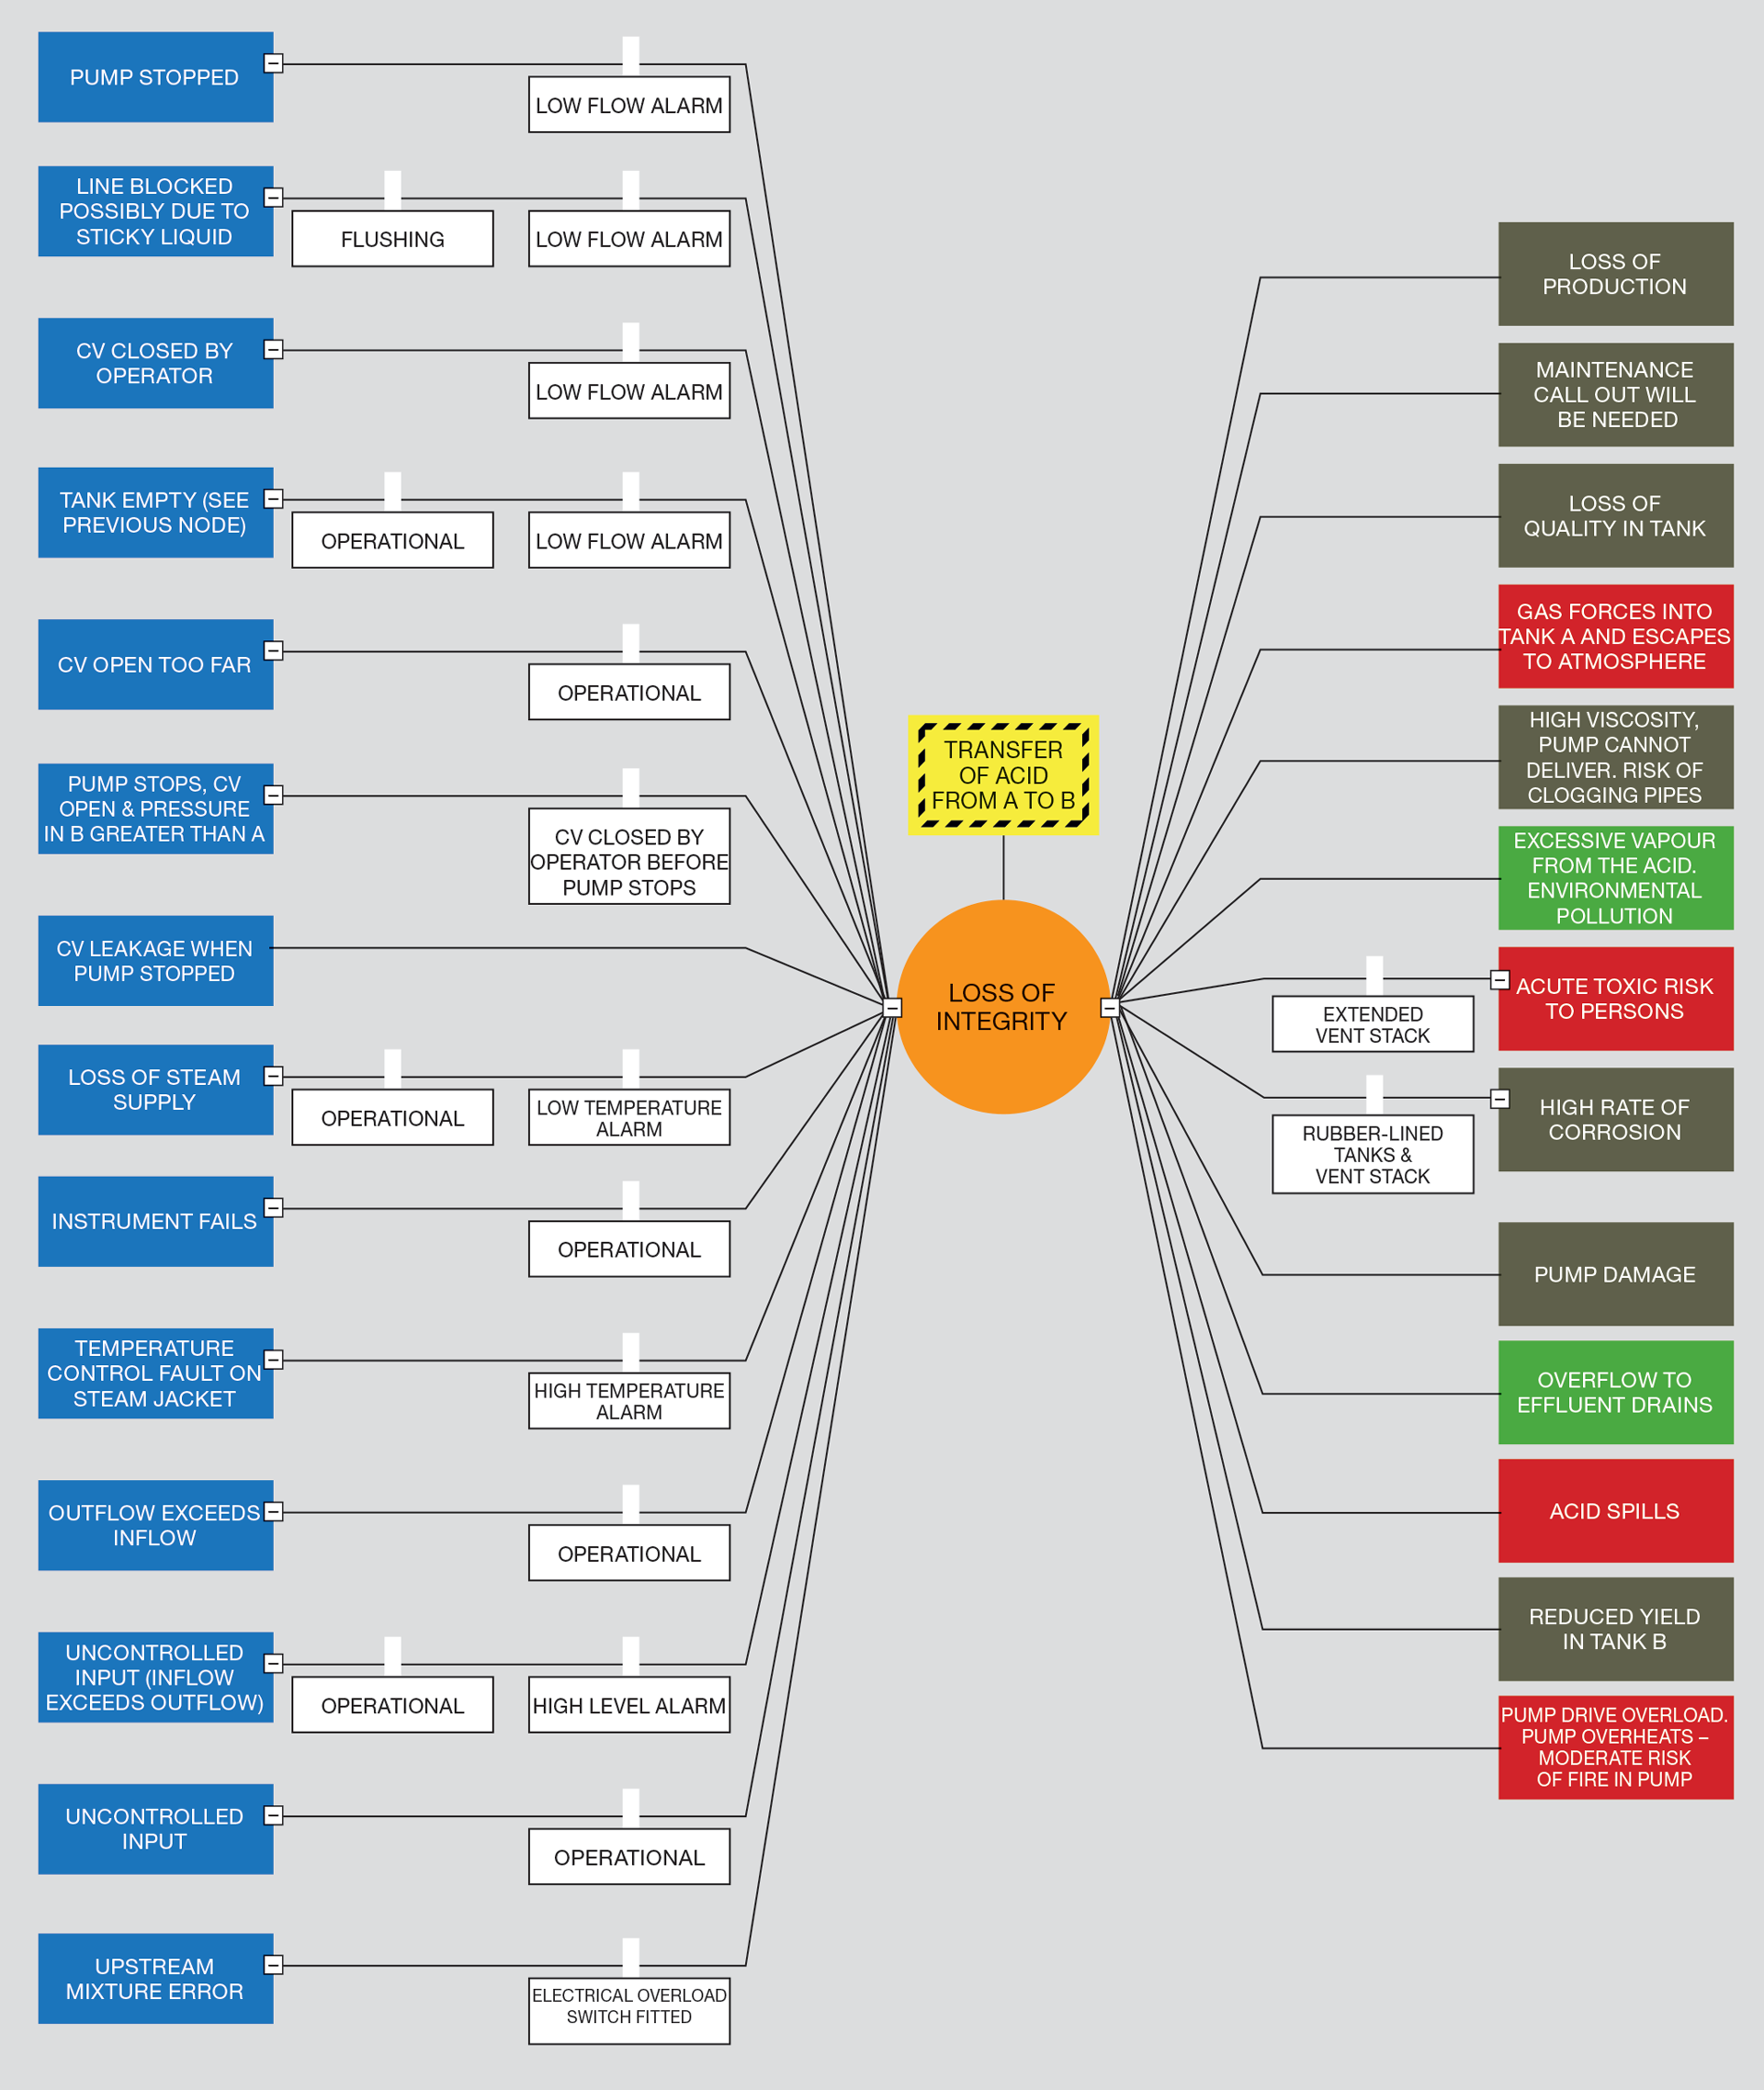
However, representing this in a bowtie (consequences are colour coded to represent the impact type) shows a potential imbalance between prevention and mitigation safeguards (see Figure 6).
As mentioned earlier, this imbalance might be identified if the HAZOP worksheet was converted to a bowtie after the study, and whilst it is never too late to address issues unless and until the incident actually occurs, it is more efficient to spot such discrepancies while the knowledge is still in the room – hence the proposal to record the discussion in real-time using the bowtie format.
Benefits
Representing hazard scenarios in graphical rather than written format enables participants to maintain focus as they are not burdened by masses of text, yet they can be confident that their contributions are recognised and recorded.
Showing safeguards as barriers on their respective side of the top event ensures that the complete protection portfolio is represented and encourages the team to discuss and document each scenario all the way to its conclusion and not just stop at the hazard without considering what recovery measures may be available or what resilience is necessary. A single view of a node presents oversight of the number of threats to, consequences from, and the associated barriers protecting an asset.
Conversely, viewers can focus on areas of interest, eg cause-consequence relationships or barriers which are deployed in multiple locations which may be susceptible to common cause failure by the nature of their type, technology employed, or requirement for manual interaction.
Drawbacks
HAZOP has proven its worth for several decades and it is acknowledged that attempts to change it may be perceived as compromising its effectiveness. This is addressed by clarifying that the HAZOP method remains unchanged, it is simply how studies are captured and communicated that offers advantages within and beyond the meeting room.
Conclusions
The well-established HAZOP procedure can be applied in a more effective format using bowties rather than worksheets without compromising the systematic rigour offered by the technique.
Visual representation maintains participant engagement and encourages discussion on scenarios that are not apparent from tabular recording.
The graphical illustration of the threats (causes), barriers (safeguards), and consequences make it easier to share the outcome from the HAZOP to those who are responsible for sustaining the protection measures but were either not present or some time has passed since the study was conducted and the results published.
References
1. Lawley, HG, 1974, “Operability study and hazard analysis”, Chemical Engineering Progress, 70 (4), pp 45-56.
2. IEC 61882: 2016, Hazard and operability studies (HAZOP studies) – Application guide.
3. IChemE HAZOP: Guide to Best Practice, 3rd Edition.
4. CCPS Guidelines for Hazard Evaluation Procedures, 3rd Edition.
5. IChemE HAZOP and HAZAN, 4th Edition.
6. Jones, DW, “Lessons from HAZOP experiences”, Hydrocarbon Processing, April 1992.
7. HSE Offshore Technology Report OTO 96 002, Quality Assurance of HAZOP.
8. Health & Safety Laboratory: Review of Hazard Identification Techniques, HSL/2005/58.
9. The Public Inquiry Into the Piper Alpha Disaster, HMSO.
Recent Editions
Catch up on the latest news, views and jobs from The Chemical Engineer. Below are the four latest issues. View a wider selection of the archive from within the Magazine section of this site.


