Rules of Thumb: Pump and System Curves
Stephen Hall discusses the golden rules for design
This month I explain how to calculate a system curve, overlay it on a pump curve, and determine the flow rate that the pump will deliver through your pipeline. You’ll see how to simulate the pump at any speed, which is an important, and recommended, way to control flow rather than using a control valve or orifice. And I’ll reveal the power that is hidden in an under-documented Excel formula which will enable you to build a dynamic spreadsheet to solve the flow rate problem.
Centrifugal pumps operate on a curve that plots flow rate against the pumping head. Most of the charts that manufacturers publish have multiple curves that represent the performance of different impeller sizes. The charts are specific to a pump size and speed. Similarly, for a given piping installation, the pressure drop through the pipeline depends on the flow rate; a plot of pressure drop against flow is called the system curve. When overlaid on the pump curve, the system’s operating point is found where the two curves intersect.
I’ll reveal the power that is hidden in an under-documented Excel formula which will enable you to build a dynamic spreadsheet to solve the flow rate problem
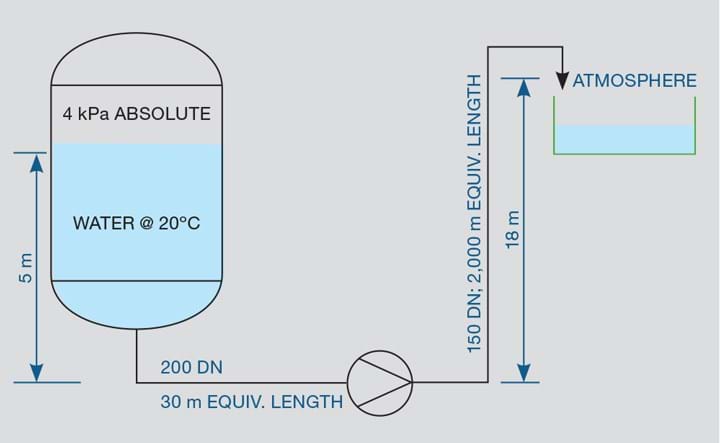
Begin with the system curve. Sketch the system from the pumped liquid’s source to its destination, including the location of the pump (Figure 1).
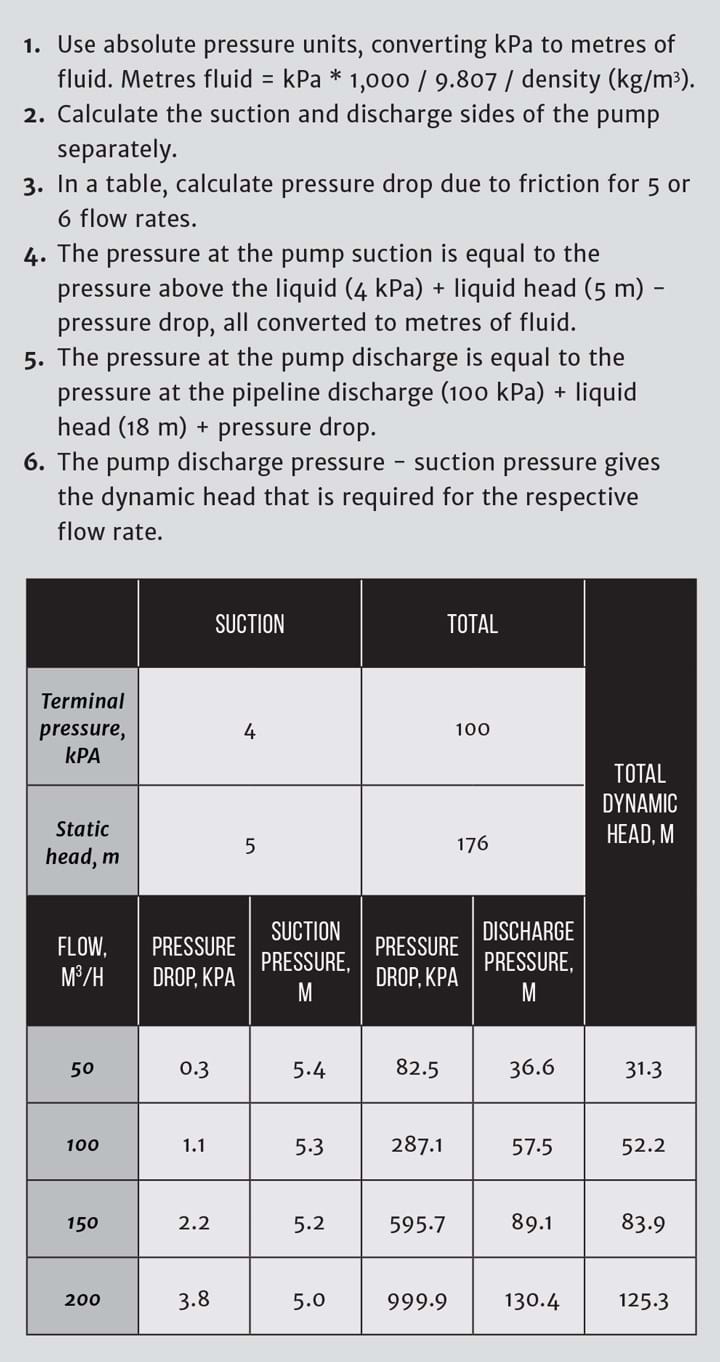
Construct a set of calculations that yield the required pumping head for any given flow rate. Here are instructions for setting up the spreadsheet:
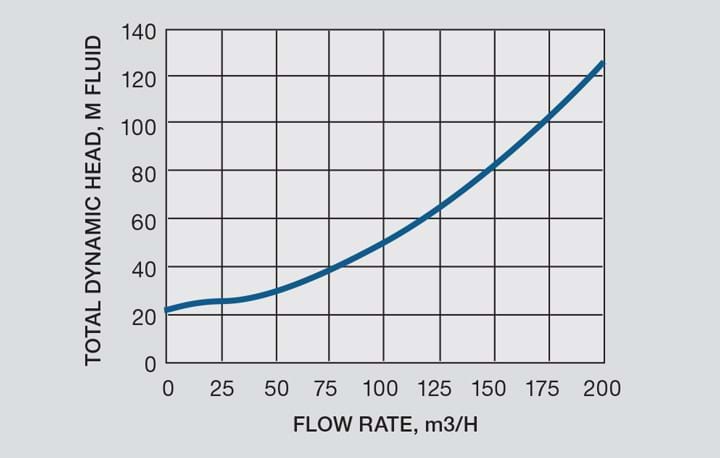
Plot the system curve as shown in Figure 2.
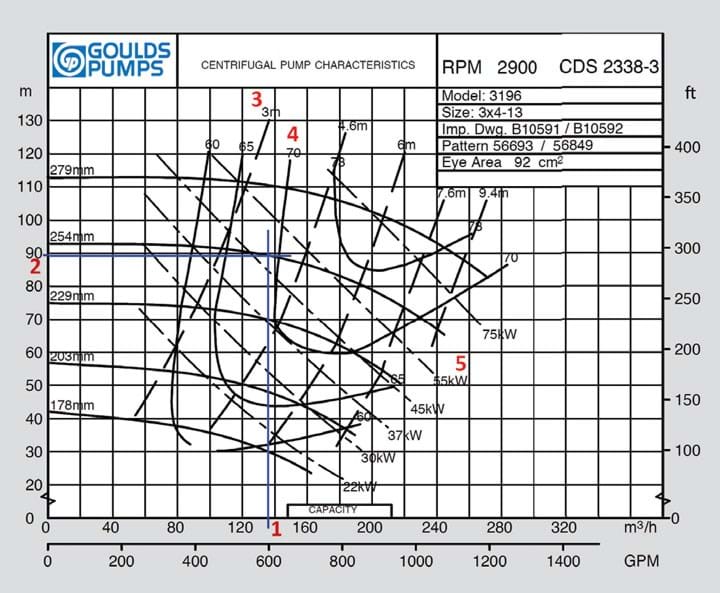
Obtain performance curves for a pump model from the pump manufacturer. For this example I’ve chosen a Goulds Pumps Model 3196. Suppose the desired flow rate through this pipeline is approximately 140 m3/h. That gives a TDH of about 80 m. I paged through the curves for the different pump sizes and selected the 3x4-13.
The manufacturer’s published performance curve is reproduced in Figure 3. The vertical blue line (1) from 138 m3/h intersects the curve for the 254 mm impeller at 88 m head. Interpolate the net positive suction head required (NPSHR) from the 3 m and 4.6 m lines (3). The pump efficiency is about 69% (4). The motor power should be specified as 55 kW at a minimum (5), but by following the 254 mm curve to its terminus at 240 m3/h you can see that a 75 kW motor would be “non-overloading at runout” and that is the choice that a conservative engineer would make.
I could claim victory at this point. The calculations aren’t so precise that the differences between my target 140 m3/h and 80 m TDH are significant. But precise control of the flow rate is achievable by adjusting the pump speed. I’ll model the system with speed control by using a little-known feature in Excel, applying affinity laws, and incorporating some algebra. This will add confidence to the design along with satisfaction that the job was done right.
For the model, I’m going to deliberately oversize the pump by selecting a larger impeller size, 279 mm. By running this pump at a reduced speed the pump curve moves down and it will function just like the smaller impeller. The power draw and efficiency will be the same, so the advantage is that the larger impeller will cover possible errors in the pressure drop calculations, account for future performance deterioration (due to corrosion in the pipe for example), and provide some flexibility to add additional components in the pipeline that will add pressure drop.
Start by constructing a table with flow and head for the 279 mm impeller. Read them off the curve. These values are at 2,900 rpm as seen on the pump manufacturer’s curve. Shift the curve to any other speed by using affinity laws. For each point at 2,900 rpm, calculate the corresponding points for the new speed with:
Flow2 = Flow1 (Speed2/Speed1)
TDH2 = TDH1 (Speed2/Speed1)2
The competed table is below, and the plot is shown in Figure 4.
Recent Editions
Catch up on the latest news, views and jobs from The Chemical Engineer. Below are the four latest issues. View a wider selection of the archive from within the Magazine section of this site.


