Modelling with Excel Part 5: Visualising Batch Processes with Gantt Charts
Stephen Hall continues his series on how to use Excel for project engineering. Download the interactive workbook to experiment with as the series develops
GANTT charts are a great vehicle for visualising batch processes that use a set of equipment in sequential steps. A Gantt chart lists tasks, equipment, or resources and shows the utilisation of those items with horizontal bars over periods of time. They are often used to depict project schedules but should be in your toolbox if you are creating a simulation with a timeline. This article will show how I create them using Excel’s drawing tools and VBA subroutines.
You need some data before you can create a Gantt chart. The core requirement is the list of tasks or activities to include in the chart. For each item in the list, you must know the starting time and duration. You also need the extent of the chart (beginning and ending times). The task and chart times should have the same units (e.g., minutes, hours or days).
Simple example problem
The task list will typically be output from your modelling. Since I need the list to demonstrate the use of the subroutines, the workbook includes a trivial illustrative scheduling example. See Figure 1. The Gantt chart will place each step in the list on the row that is defined by “Line”. The “Clean reactor” Gantt bar will appear on the same row as “Charge reactor.” The first Caption for each Line will be used to label the Gantt rows (“Charge reactor,” not “Clean reactor”).
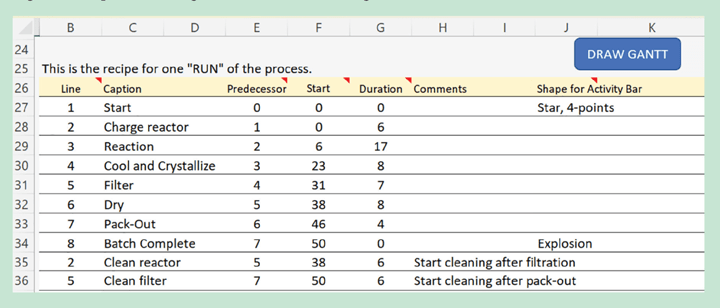
The Gantt bars will begin at the time indicated by “Earliest Start” unless the “Predecessor” activity ends at a later time as determined by “Duration”. Earliest Start in Figure 1 is listed as the ending time for the item’s predecessor. But the Gantt model will also include a calendar that specifies the time period in which a task is permitted to start. If a task ends at 4 a.m. but the calendar specifies a 6 a.m. workday starting time then the subsequent task will not begin until 6 a.m.
The ”Shape” column in Figure 1 will cause that Line’s Gantt bar to take the specified shape instead of being a simple bar.
When simulating a batch process, especially where operator interventions are required, certain activities might have restrictive timeframes. For instance, cleaning might occur only on third shift, or perhaps all the tasks may only be started during first and second shifts on weekdays. I included a global starting time restriction in this example to illustrate the point.
The Gantt chart is drawn by a VBA subroutine that I will refer to as the “primary” subroutine. Additional VBA subroutines are called by the primary routine.
Graphical elements
There are five sets of graphical elements in the Gantt chart that I am presenting here (Figure 2). Timelines are vertical lines that represent hours and days. The timeline labels identify the scale. Gantt bars are horizontal rectangles that show the duration of activities. Milestones are represented with symbols such as stars. The fifth element is the list of activity names. They can be drawn in any sequence. The way I designed them they stack such that when elements overlap the last one that is drawn is on top and may partially obscure elements beneath it. You can, of course, add additional elements such as a color key or flow arrows although they are not included in this example.

To draw a graphical element using Visual Basic for Applications (VBA), a statement of this form is used: AddShape(Type, Left, Top, Width, Height). Type specifies the form of the shape. The other parameters place the shape on the worksheet window. The main challenge is calculating those positioning parameters.
Setting up the chart
Recent Editions
Catch up on the latest news, views and jobs from The Chemical Engineer. Below are the four latest issues. View a wider selection of the archive from within the Magazine section of this site.